Andersons Pond Dam dam

Andersons Pond Dam
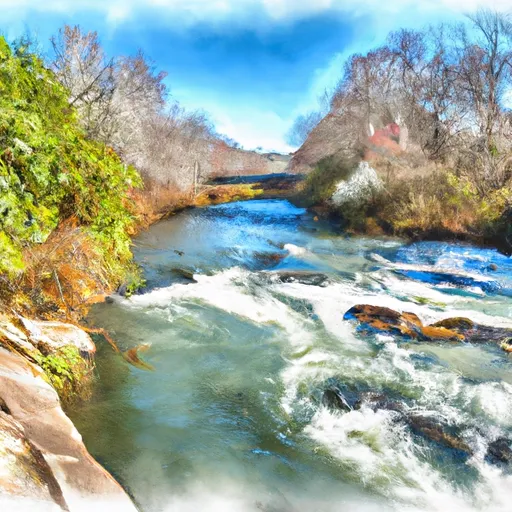
Andersons Pond Dam, located in Barnwell, South Carolina, stands as a testament to the importance of water resource management and climate resilience in the region. Built in 1940, this private recreational dam on Rosemary Creek serves as a vital resource for the community, offering a surface area of 36 acres and a storage capacity of 200 acre-feet. With a dam height of 15 feet and a length of 345 feet, Andersons Pond Dam plays a crucial role in flood control and water supply management in the area.
Despite its age, Andersons Pond Dam is regularly inspected by the South Carolina Department of Health and Environmental Control (DHEC) to ensure its structural integrity and safety. Classified as having a high hazard potential, the dam is deemed to be in fair condition, with the last assessment conducted in December 2019. With a designated emergency action plan in place and a two-year inspection frequency, the owners of Andersons Pond Dam are committed to maintaining the dam's functionality and safety for the surrounding community.
As climate change continues to impact water resources and infrastructure across the country, the role of dams like Andersons Pond Dam in providing recreation, flood control, and water supply becomes increasingly critical. With its earth core and stone foundation, this dam serves as a resilient structure that not only enhances the quality of life for residents but also underscores the importance of proactive management and investment in water resource systems for a sustainable future.
Plan around the weather
Same NOAA / yr.no feed Snoflo's iOS app uses. Watch the precipitation column on the meteogram -- rain on the basin upstream typically lifts inflow 24-72 hours later.
Next 5 days, hour by hour
Temperature line with weather symbols on top, snow + rain accumulation as columns, humidity as a dotted line.
5-day forecast table
Every 3 hours, broken out across temperature, snow, rain, humidity, and wind. Each cell is colour-coded relative to the column min/max.
| Time | Condition | Temp (°F) | Snow (in) | Rain (in) | Humidity (%) | Wind (mps) | Wind dir |
|---|---|---|---|---|---|---|---|
| Loading detailed forecast… | |||||||
15-day temperature & precipitation
Daily temperatures, snow, and rain projected over the next two weeks.
Nearby streamflow gauges
USGS streamgauges around Andersons Pond Dam -- inflows here typically show up in storage 24-72 hours later.
| Streamgauge | Discharge | View |
|---|---|---|
| South Fork Edisto River Near Denmark | 252 cfs | → |
| South Fork Edisto River Near Cope | 293 cfs | → |
| South Fork Edisto River Near Bamberg | 323 cfs | → |
| Savannah R At Burtons Ferry Br Nr Millhaven | 4,660 cfs | → |
| Savannah River At Augusta | 6,190 cfs | → |
| Brier Creek At Millhaven | 132 cfs | → |


About Andersons Pond Dam
Where does the data for Andersons Pond Dam come from?
Structural and regulatory data come from the U.S. Army Corps of Engineers' National Inventory of Dams (NID). Weather forecast comes from NOAA / yr.no -- the same feed Snoflo's iOS app uses.
How often is the report updated?
NID structural data refreshes annually as the Corps publishes updated assessments. The weather forecast refreshes throughout the day.
What does the High hazard rating mean?
The Corps of Engineers' hazard potential classification grades probable consequences if the dam fails: High = probable loss of human life; Significant = no probable loss of human life but possible economic loss / environmental damage; Low = no probable loss of human life, only minor economic / environmental losses. See the Dam Data Reference card below for the full definitions.
What's "% of normal"?
The current storage value compared to the historical average storage on this calendar day. 100% = right on average; values above 100% mean above-normal storage (wet year); values below mean below-normal (dry year or drought).
Can I get alerts when storage crosses a threshold?
Yes -- alerts are managed in the Snoflo iOS app. Favorite this dam, set a threshold, and you'll get a push the moment conditions cross.
Dam data reference
Condition Assessment
- Satisfactory
- No existing or potential dam safety deficiencies are recognized. Acceptable performance is expected under all loading conditions (static, hydrologic, seismic) in accordance with the minimum applicable state or federal regulatory criteria or tolerable risk guidelines.
- Fair
- No existing dam safety deficiencies are recognized for normal operating conditions. Rare or extreme hydrologic and/or seismic events may result in a dam safety deficiency. Risk may be in the range to take further action.
- Poor
- A dam safety deficiency is recognized for normal operating conditions which may realistically occur. Remedial action is necessary. POOR may also be used when uncertainties exist as to critical analysis parameters which identify a potential dam safety deficiency.
- Unsatisfactory
- A dam safety deficiency is recognized that requires immediate or emergency remedial action for problem resolution.
- Not Rated
- The dam has not been inspected, is not under state or federal jurisdiction, or has been inspected but, for whatever reason, has not been rated.
Hazard Potential Classification
- High
- Dams assigned the high hazard potential classification are those where failure or mis-operation will probably cause loss of human life.
- Significant
- Dams assigned the significant hazard potential classification are those dams where failure or mis-operation results in no probable loss of human life but can cause economic loss, environmental damage, disruption of lifeline facilities, or impact other concerns. Significant hazard potential classification dams are often located in predominantly rural or agricultural areas but could be in areas with population and significant infrastructure.
- Low
- Dams assigned the low hazard potential classification are those where failure or mis-operation results in no probable loss of human life and low economic and/or environmental losses. Losses are principally limited to the owner's property.
- Undetermined
- Dams for which a downstream hazard potential has not been designated or is not provided.