Lillie's Dam

Lillie's Dam
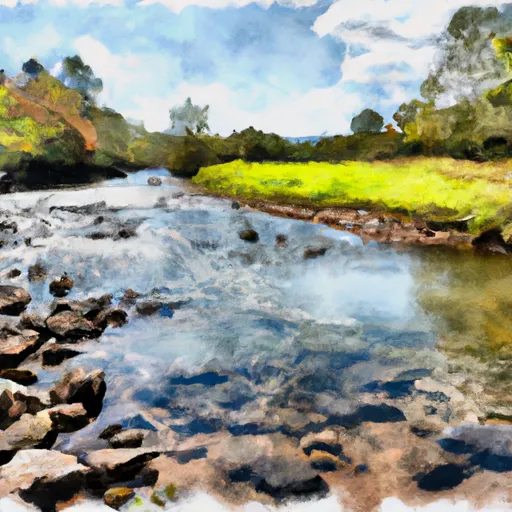
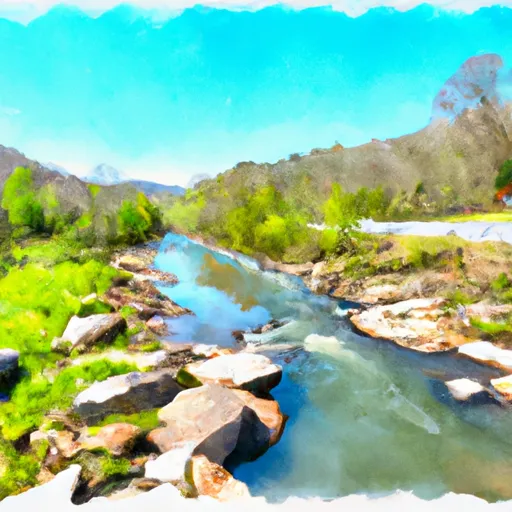
Lillie's Dam, also known as Pearsall Dam and Garrett Pond Dam, is a privately owned earth dam located in Cumberland, Virginia. Situated on the Little Guinea Creek, this recreational dam stands at a height of 29.3 feet with a length of 410 feet. With a storage capacity of 392 acre-feet and a surface area of 30 acres, Lillie's Dam provides a picturesque setting for outdoor activities and water-based recreation.
Managed by the Department of Conservation and Recreation in Virginia, Lillie's Dam has a low hazard potential and is currently deemed to be in a condition that is not rated. The dam's last inspection was conducted in April 2012, with a scheduled inspection frequency of once every year. While the dam's emergency action plan (EAP) status and risk assessment details are not provided in the data, it is clear that the structure serves primarily for recreational purposes and contributes to the local water resource landscape.
With its serene location and essential role in providing recreational opportunities, Lillie's Dam stands as a testament to the harmonious coexistence of water resource management and climate-conscious recreation. As enthusiasts of water resources and climate, the data surrounding Lillie's Dam offers a glimpse into the intersection of human ingenuity and environmental stewardship, highlighting the importance of sustainable infrastructure in enhancing our connection to nature and ensuring the safety and enjoyment of all who benefit from these resources.
Plan around the weather
Same NOAA / yr.no feed Snoflo's iOS app uses. Watch the precipitation column on the meteogram -- rain on the basin upstream typically lifts inflow 24-72 hours later.
Next 5 days, hour by hour
Temperature line with weather symbols on top, snow + rain accumulation as columns, humidity as a dotted line.
5-day forecast table
Every 3 hours, broken out across temperature, snow, rain, humidity, and wind. Each cell is colour-coded relative to the column min/max.
| Time | Condition | Temp (°F) | Snow (in) | Rain (in) | Humidity (%) | Wind (mps) | Wind dir |
|---|---|---|---|---|---|---|---|
| Loading detailed forecast… | |||||||
15-day temperature & precipitation
Daily temperatures, snow, and rain projected over the next two weeks.
Nearby streamflow gauges
USGS streamgauges around Lillie's Dam -- inflows here typically show up in storage 24-72 hours later.
| Streamgauge | Discharge | View |
|---|---|---|
| James River At Cartersville | 1,550 cfs | → |
| Appomattox River At Farmville | 71 cfs | → |
| Slate River Near Arvonia | 30 cfs | → |
| Appomattox River At Mattoax | 158 cfs | → |
| Buffalo Creek Near Hampden Sydney | 20 cfs | → |
| Holiday Creek Near Andersonville | 2 cfs | → |


About Lillie's Dam
Where does the data for Lillie's Dam come from?
Structural and regulatory data come from the U.S. Army Corps of Engineers' National Inventory of Dams (NID). Weather forecast comes from NOAA / yr.no -- the same feed Snoflo's iOS app uses.
How often is the report updated?
NID structural data refreshes annually as the Corps publishes updated assessments. The weather forecast refreshes throughout the day.
What does the Low hazard rating mean?
The Corps of Engineers' hazard potential classification grades probable consequences if the dam fails: High = probable loss of human life; Significant = no probable loss of human life but possible economic loss / environmental damage; Low = no probable loss of human life, only minor economic / environmental losses. See the Dam Data Reference card below for the full definitions.
What's "% of normal"?
The current storage value compared to the historical average storage on this calendar day. 100% = right on average; values above 100% mean above-normal storage (wet year); values below mean below-normal (dry year or drought).
Can I get alerts when storage crosses a threshold?
Yes -- alerts are managed in the Snoflo iOS app. Favorite this dam, set a threshold, and you'll get a push the moment conditions cross.
Dam data reference
Condition Assessment
- Satisfactory
- No existing or potential dam safety deficiencies are recognized. Acceptable performance is expected under all loading conditions (static, hydrologic, seismic) in accordance with the minimum applicable state or federal regulatory criteria or tolerable risk guidelines.
- Fair
- No existing dam safety deficiencies are recognized for normal operating conditions. Rare or extreme hydrologic and/or seismic events may result in a dam safety deficiency. Risk may be in the range to take further action.
- Poor
- A dam safety deficiency is recognized for normal operating conditions which may realistically occur. Remedial action is necessary. POOR may also be used when uncertainties exist as to critical analysis parameters which identify a potential dam safety deficiency.
- Unsatisfactory
- A dam safety deficiency is recognized that requires immediate or emergency remedial action for problem resolution.
- Not Rated
- The dam has not been inspected, is not under state or federal jurisdiction, or has been inspected but, for whatever reason, has not been rated.
Hazard Potential Classification
- High
- Dams assigned the high hazard potential classification are those where failure or mis-operation will probably cause loss of human life.
- Significant
- Dams assigned the significant hazard potential classification are those dams where failure or mis-operation results in no probable loss of human life but can cause economic loss, environmental damage, disruption of lifeline facilities, or impact other concerns. Significant hazard potential classification dams are often located in predominantly rural or agricultural areas but could be in areas with population and significant infrastructure.
- Low
- Dams assigned the low hazard potential classification are those where failure or mis-operation results in no probable loss of human life and low economic and/or environmental losses. Losses are principally limited to the owner's property.
- Undetermined
- Dams for which a downstream hazard potential has not been designated or is not provided.