Lake Elizabeth Dam dam

Lake Elizabeth Dam
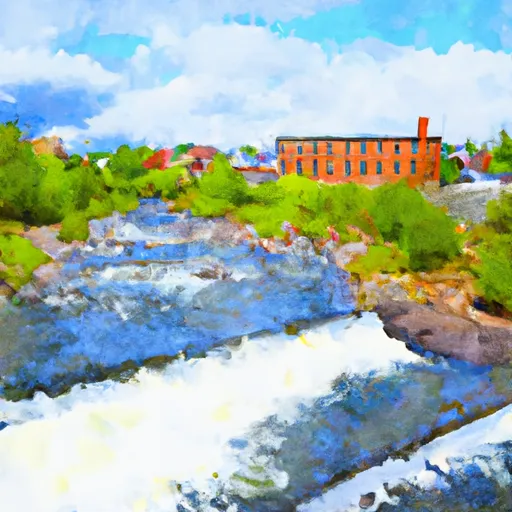
Located in Grafton, New York, the Lake Elizabeth Dam is a privately-owned structure regulating the waters of the Quacken Kill. Built in 1950, this recreational dam stands at 18 feet high and stretches 170 feet in length, creating a storage capacity of 98 acre-feet. With a surface area of 14 acres and a drainage area of 1.25 square miles, the dam boasts a spillway width of 20 feet and a hazard potential rated as low.
The New York State Department of Environmental Conservation regulates the operation, inspection, and enforcement of the Lake Elizabeth Dam, ensuring its compliance with safety standards. Despite being deemed as not rated in terms of condition assessment, the dam poses a moderate risk level. While emergency preparedness measures such as an Emergency Action Plan (EAP) and inundation maps have not been updated or developed, the dam continues to serve its primary purpose for recreation in the Rensselaer County area.
Water resource and climate enthusiasts can appreciate the significance of the Lake Elizabeth Dam in maintaining a balanced ecosystem and providing a recreational space for the community. As a vital component in managing the flow of the Quacken Kill, this earth dam symbolizes the intersection of human ingenuity and environmental stewardship in safeguarding water resources for future generations.
Plan around the weather
Same NOAA / yr.no feed Snoflo's iOS app uses. Watch the precipitation column on the meteogram -- rain on the basin upstream typically lifts inflow 24-72 hours later.
Next 5 days, hour by hour
Temperature line with weather symbols on top, snow + rain accumulation as columns, humidity as a dotted line.
5-day forecast table
Every 3 hours, broken out across temperature, snow, rain, humidity, and wind. Each cell is colour-coded relative to the column min/max.
| Time | Condition | Temp (°F) | Snow (in) | Rain (in) | Humidity (%) | Wind (mps) | Wind dir |
|---|---|---|---|---|---|---|---|
| Loading detailed forecast… | |||||||
15-day temperature & precipitation
Daily temperatures, snow, and rain projected over the next two weeks.
Nearby streamflow gauges
USGS streamgauges around Lake Elizabeth Dam -- inflows here typically show up in storage 24-72 hours later.
| Streamgauge | Discharge | View |
|---|---|---|
| Hudson River At Lock 1 Near Waterford Ny | 8,410 cfs | → |
| Hudson R Above Lock 1 Nr Waterford Ny | 3,410 cfs | → |
| Hoosic River Near Eagle Bridge Ny | 280 cfs | → |
| Hudson River At Green Island Ny | 6,530 cfs | → |
| Green River At Williamstown | 21 cfs | → |
| Mohawk River At Cohoes Ny | 952 cfs | → |


About Lake Elizabeth Dam
Where does the data for Lake Elizabeth Dam come from?
Structural and regulatory data come from the U.S. Army Corps of Engineers' National Inventory of Dams (NID). Weather forecast comes from NOAA / yr.no -- the same feed Snoflo's iOS app uses.
How often is the report updated?
NID structural data refreshes annually as the Corps publishes updated assessments. The weather forecast refreshes throughout the day.
What does the Low hazard rating mean?
The Corps of Engineers' hazard potential classification grades probable consequences if the dam fails: High = probable loss of human life; Significant = no probable loss of human life but possible economic loss / environmental damage; Low = no probable loss of human life, only minor economic / environmental losses. See the Dam Data Reference card below for the full definitions.
What's "% of normal"?
The current storage value compared to the historical average storage on this calendar day. 100% = right on average; values above 100% mean above-normal storage (wet year); values below mean below-normal (dry year or drought).
Can I get alerts when storage crosses a threshold?
Yes -- alerts are managed in the Snoflo iOS app. Favorite this dam, set a threshold, and you'll get a push the moment conditions cross.
Dam data reference
Condition Assessment
- Satisfactory
- No existing or potential dam safety deficiencies are recognized. Acceptable performance is expected under all loading conditions (static, hydrologic, seismic) in accordance with the minimum applicable state or federal regulatory criteria or tolerable risk guidelines.
- Fair
- No existing dam safety deficiencies are recognized for normal operating conditions. Rare or extreme hydrologic and/or seismic events may result in a dam safety deficiency. Risk may be in the range to take further action.
- Poor
- A dam safety deficiency is recognized for normal operating conditions which may realistically occur. Remedial action is necessary. POOR may also be used when uncertainties exist as to critical analysis parameters which identify a potential dam safety deficiency.
- Unsatisfactory
- A dam safety deficiency is recognized that requires immediate or emergency remedial action for problem resolution.
- Not Rated
- The dam has not been inspected, is not under state or federal jurisdiction, or has been inspected but, for whatever reason, has not been rated.
Hazard Potential Classification
- High
- Dams assigned the high hazard potential classification are those where failure or mis-operation will probably cause loss of human life.
- Significant
- Dams assigned the significant hazard potential classification are those dams where failure or mis-operation results in no probable loss of human life but can cause economic loss, environmental damage, disruption of lifeline facilities, or impact other concerns. Significant hazard potential classification dams are often located in predominantly rural or agricultural areas but could be in areas with population and significant infrastructure.
- Low
- Dams assigned the low hazard potential classification are those where failure or mis-operation results in no probable loss of human life and low economic and/or environmental losses. Losses are principally limited to the owner's property.
- Undetermined
- Dams for which a downstream hazard potential has not been designated or is not provided.