Little Grass Valley dam

Little Grass Valley
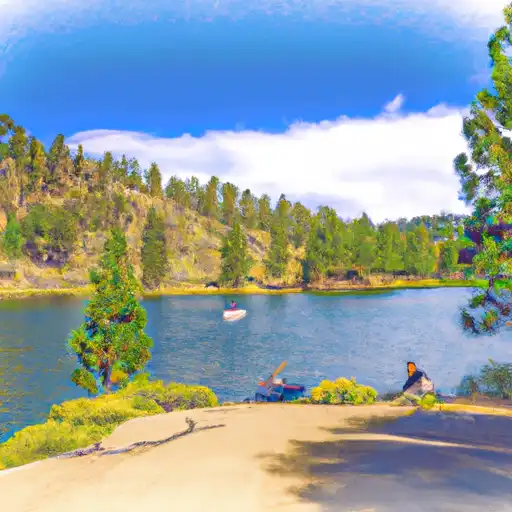
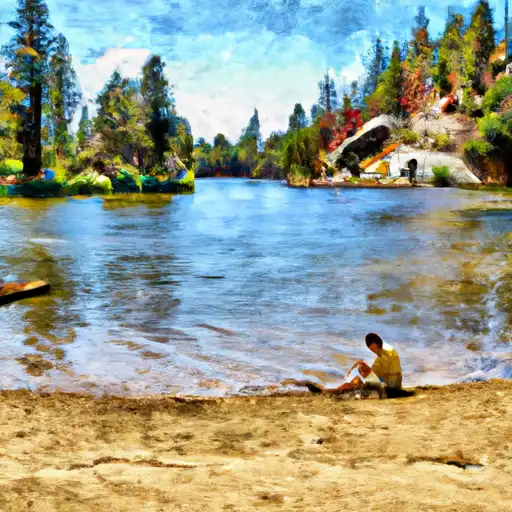
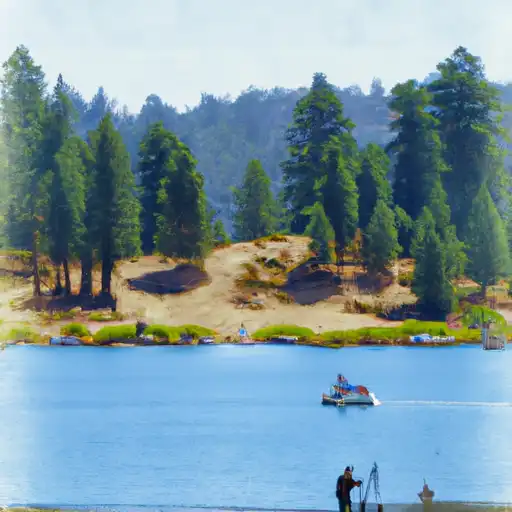
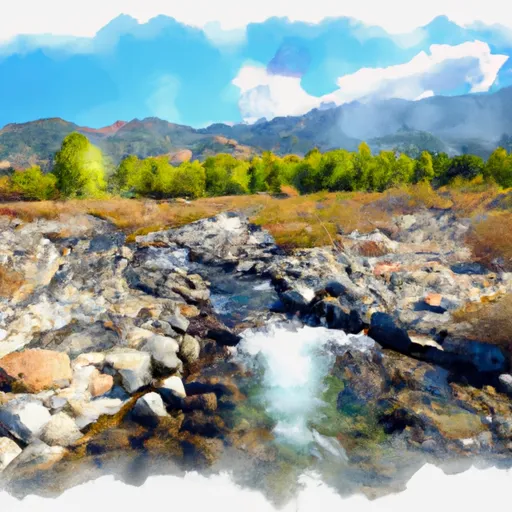
Little Grass Valley is a captivating hydroelectric dam nestled in the scenic Plumas County, California, near the quaint town of Golden Trout Crossing. Built in 1961 by Bechtel, this Earth dam stands at an impressive height of 184 feet, with a hydraulic height of 198 feet and a structural height of 210 feet. The dam's primary purpose is hydroelectric power generation, while also serving irrigation and water supply needs in the region.
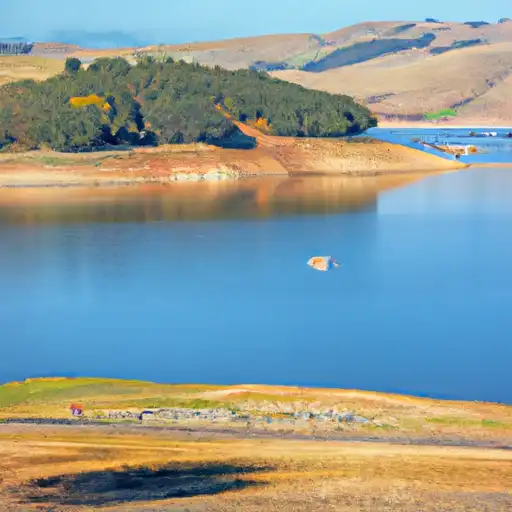
With a storage capacity of 94,660 acre-feet and a normal storage of 93,010 acre-feet, Little Grass Valley ensures a reliable water supply for the surrounding area. The dam's controlled spillway, with a width of 80 feet, helps manage potential high-hazard risks associated with the dam. Despite its very high risk assessment, the dam has not undergone a recent condition assessment. However, the Federal Energy Regulatory Commission oversees inspections to ensure the safety and integrity of the structure.
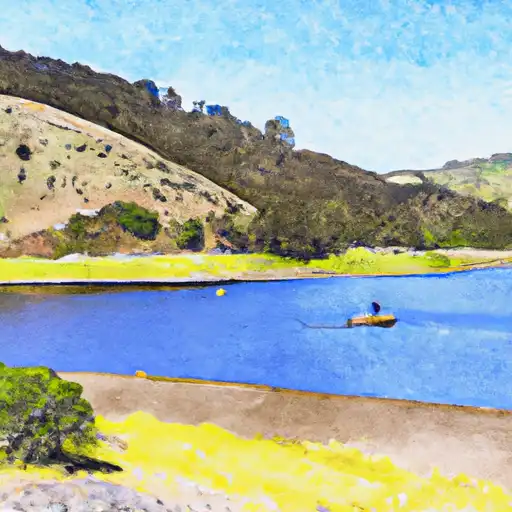
Surrounded by the beauty of the South Fork Feather River and boasting a surface area of 1630 acres, Little Grass Valley is a vital component of California's water resource infrastructure. Its role in providing clean energy and essential water resources underscores the importance of sustainable management practices for water and climate enthusiasts in the region.
Plan around the weather
Same NOAA / yr.no feed Snoflo's iOS app uses. Watch the precipitation column on the meteogram -- rain on the basin upstream typically lifts inflow 24-72 hours later.
Next 5 days, hour by hour
Temperature line with weather symbols on top, snow + rain accumulation as columns, humidity as a dotted line.
5-day forecast table
Every 3 hours, broken out across temperature, snow, rain, humidity, and wind. Each cell is colour-coded relative to the column min/max.
| Time | Condition | Temp (°F) | Snow (in) | Rain (in) | Humidity (%) | Wind (mps) | Wind dir |
|---|---|---|---|---|---|---|---|
| Loading detailed forecast… | |||||||
15-day temperature & precipitation
Daily temperatures, snow, and rain projected over the next two weeks.
Nearby streamflow gauges
USGS streamgauges around Little Grass Valley -- inflows here typically show up in storage 24-72 hours later.
| Streamgauge | Discharge | View |
|---|---|---|
| N Yuba R Bl Goodyears Bar Ca | 170 cfs | → |
| Spanish C A Quincy Ca | 16 cfs | → |
| Spanish C Ab Blackhawk C At Keddie Ca | 37 cfs | → |
| Butte C Nr Chico Ca | 161 cfs | → |
| Deer C Nr Smartville Ca | 3 cfs | → |
| Little Truckee R Bl Div Dam Nr Sierraville Ca | 3 cfs | → |


About Little Grass Valley
Where does the data for Little Grass Valley come from?
Structural and regulatory data come from the U.S. Army Corps of Engineers' National Inventory of Dams (NID). Weather forecast comes from NOAA / yr.no -- the same feed Snoflo's iOS app uses.
How often is the report updated?
NID structural data refreshes annually as the Corps publishes updated assessments. The weather forecast refreshes throughout the day.
What does the High hazard rating mean?
The Corps of Engineers' hazard potential classification grades probable consequences if the dam fails: High = probable loss of human life; Significant = no probable loss of human life but possible economic loss / environmental damage; Low = no probable loss of human life, only minor economic / environmental losses. See the Dam Data Reference card below for the full definitions.
What's "% of normal"?
The current storage value compared to the historical average storage on this calendar day. 100% = right on average; values above 100% mean above-normal storage (wet year); values below mean below-normal (dry year or drought).
Can I get alerts when storage crosses a threshold?
Yes -- alerts are managed in the Snoflo iOS app. Favorite this dam, set a threshold, and you'll get a push the moment conditions cross.
Dam data reference
Condition Assessment
- Satisfactory
- No existing or potential dam safety deficiencies are recognized. Acceptable performance is expected under all loading conditions (static, hydrologic, seismic) in accordance with the minimum applicable state or federal regulatory criteria or tolerable risk guidelines.
- Fair
- No existing dam safety deficiencies are recognized for normal operating conditions. Rare or extreme hydrologic and/or seismic events may result in a dam safety deficiency. Risk may be in the range to take further action.
- Poor
- A dam safety deficiency is recognized for normal operating conditions which may realistically occur. Remedial action is necessary. POOR may also be used when uncertainties exist as to critical analysis parameters which identify a potential dam safety deficiency.
- Unsatisfactory
- A dam safety deficiency is recognized that requires immediate or emergency remedial action for problem resolution.
- Not Rated
- The dam has not been inspected, is not under state or federal jurisdiction, or has been inspected but, for whatever reason, has not been rated.
Hazard Potential Classification
- High
- Dams assigned the high hazard potential classification are those where failure or mis-operation will probably cause loss of human life.
- Significant
- Dams assigned the significant hazard potential classification are those dams where failure or mis-operation results in no probable loss of human life but can cause economic loss, environmental damage, disruption of lifeline facilities, or impact other concerns. Significant hazard potential classification dams are often located in predominantly rural or agricultural areas but could be in areas with population and significant infrastructure.
- Low
- Dams assigned the low hazard potential classification are those where failure or mis-operation results in no probable loss of human life and low economic and/or environmental losses. Losses are principally limited to the owner's property.
- Undetermined
- Dams for which a downstream hazard potential has not been designated or is not provided.