De Sabla Forebay dam

De Sabla Forebay
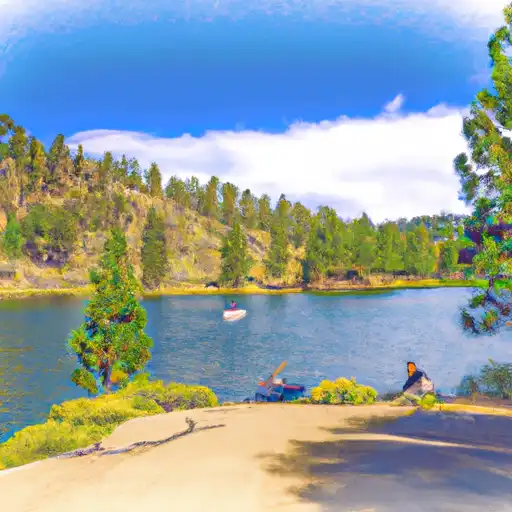
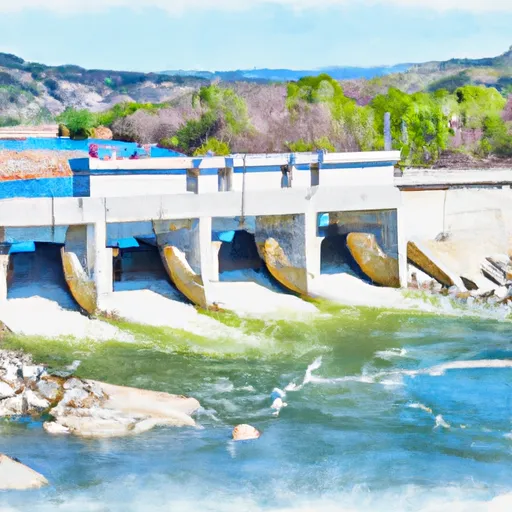
De Sabla Forebay, a privately owned hydroelectric facility located in Butte, California, serves as a vital component in the region's water resource and climate infrastructure. The dam, completed in 1962, stands at a height of 52 feet and boasts a storage capacity of 188 acre-feet, with a normal storage level of 180 acre-feet. The facility, managed by the Federal Energy Regulatory Commission, harnesses the power of Butte Creek to generate hydroelectricity, contributing to the sustainable energy production in the area.
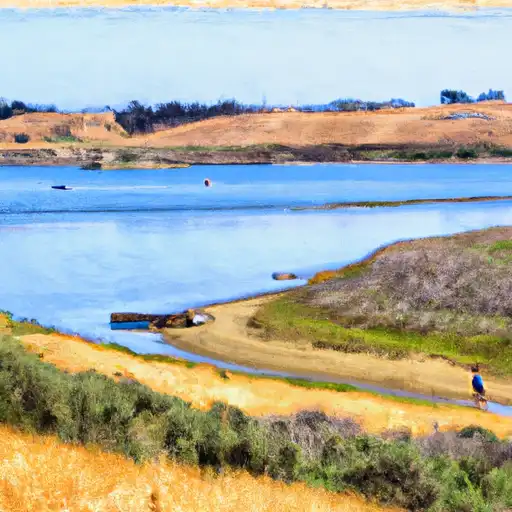
With a surface area of 14.9 acres and a maximum discharge capacity of 500 cubic feet per second, De Sabla Forebay plays a crucial role in managing water resources and mitigating potential hazards. Despite being classified as having a low hazard potential, the dam is subject to regular state inspections and enforcement measures to ensure its structural integrity and operational safety. The facility's spillway, with a width of 44 feet, utilizes an uncontrolled design to regulate water flow and maintain optimal water levels in the reservoir.
Overall, De Sabla Forebay stands as a testament to the intersection of water resource management, climate resilience, and sustainable energy production. Its strategic location, efficient design, and adherence to regulatory standards underscore its importance in supporting the region's water supply, energy needs, and environmental sustainability goals. As a key player in California's hydroelectric infrastructure, De Sabla Forebay exemplifies the ongoing efforts to balance water resource utilization with climate adaptation and mitigation strategies for a more resilient future.
Plan around the weather
Same NOAA / yr.no feed Snoflo's iOS app uses. Watch the precipitation column on the meteogram -- rain on the basin upstream typically lifts inflow 24-72 hours later.
Next 5 days, hour by hour
Temperature line with weather symbols on top, snow + rain accumulation as columns, humidity as a dotted line.
5-day forecast table
Every 3 hours, broken out across temperature, snow, rain, humidity, and wind. Each cell is colour-coded relative to the column min/max.
| Time | Condition | Temp (°F) | Snow (in) | Rain (in) | Humidity (%) | Wind (mps) | Wind dir |
|---|---|---|---|---|---|---|---|
| Loading detailed forecast… | |||||||
15-day temperature & precipitation
Daily temperatures, snow, and rain projected over the next two weeks.
Nearby streamflow gauges
USGS streamgauges around De Sabla Forebay -- inflows here typically show up in storage 24-72 hours later.
| Streamgauge | Discharge | View |
|---|---|---|
| Butte C Nr Chico Ca | 164 cfs | → |
| Deer C Nr Vina Ca | 108 cfs | → |
| Mill C Nr Los Molinos Ca | 143 cfs | → |
| Spanish C A Quincy Ca | 20 cfs | → |
| Spanish C Ab Blackhawk C At Keddie Ca | 39 cfs | → |
| Sacramento R Ab Bend Bridge Nr Red Bluff Ca | 13,300 cfs | → |


About De Sabla Forebay
Where does the data for De Sabla Forebay come from?
Structural and regulatory data come from the U.S. Army Corps of Engineers' National Inventory of Dams (NID). Weather forecast comes from NOAA / yr.no -- the same feed Snoflo's iOS app uses.
How often is the report updated?
NID structural data refreshes annually as the Corps publishes updated assessments. The weather forecast refreshes throughout the day.
What does the Low hazard rating mean?
The Corps of Engineers' hazard potential classification grades probable consequences if the dam fails: High = probable loss of human life; Significant = no probable loss of human life but possible economic loss / environmental damage; Low = no probable loss of human life, only minor economic / environmental losses. See the Dam Data Reference card below for the full definitions.
What's "% of normal"?
The current storage value compared to the historical average storage on this calendar day. 100% = right on average; values above 100% mean above-normal storage (wet year); values below mean below-normal (dry year or drought).
Can I get alerts when storage crosses a threshold?
Yes -- alerts are managed in the Snoflo iOS app. Favorite this dam, set a threshold, and you'll get a push the moment conditions cross.
Dam data reference
Condition Assessment
- Satisfactory
- No existing or potential dam safety deficiencies are recognized. Acceptable performance is expected under all loading conditions (static, hydrologic, seismic) in accordance with the minimum applicable state or federal regulatory criteria or tolerable risk guidelines.
- Fair
- No existing dam safety deficiencies are recognized for normal operating conditions. Rare or extreme hydrologic and/or seismic events may result in a dam safety deficiency. Risk may be in the range to take further action.
- Poor
- A dam safety deficiency is recognized for normal operating conditions which may realistically occur. Remedial action is necessary. POOR may also be used when uncertainties exist as to critical analysis parameters which identify a potential dam safety deficiency.
- Unsatisfactory
- A dam safety deficiency is recognized that requires immediate or emergency remedial action for problem resolution.
- Not Rated
- The dam has not been inspected, is not under state or federal jurisdiction, or has been inspected but, for whatever reason, has not been rated.
Hazard Potential Classification
- High
- Dams assigned the high hazard potential classification are those where failure or mis-operation will probably cause loss of human life.
- Significant
- Dams assigned the significant hazard potential classification are those dams where failure or mis-operation results in no probable loss of human life but can cause economic loss, environmental damage, disruption of lifeline facilities, or impact other concerns. Significant hazard potential classification dams are often located in predominantly rural or agricultural areas but could be in areas with population and significant infrastructure.
- Low
- Dams assigned the low hazard potential classification are those where failure or mis-operation results in no probable loss of human life and low economic and/or environmental losses. Losses are principally limited to the owner's property.
- Undetermined
- Dams for which a downstream hazard potential has not been designated or is not provided.