Warren Lake dam

Warren Lake
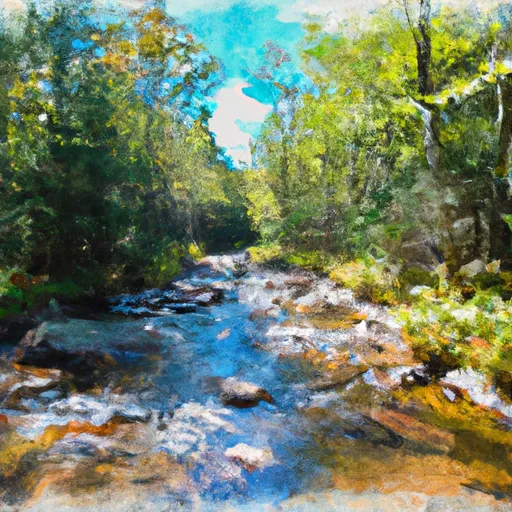
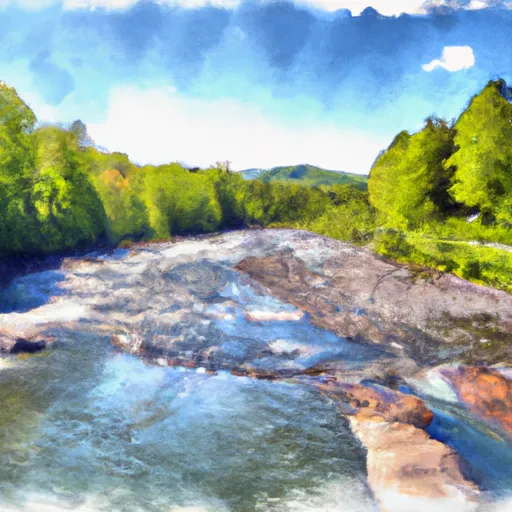
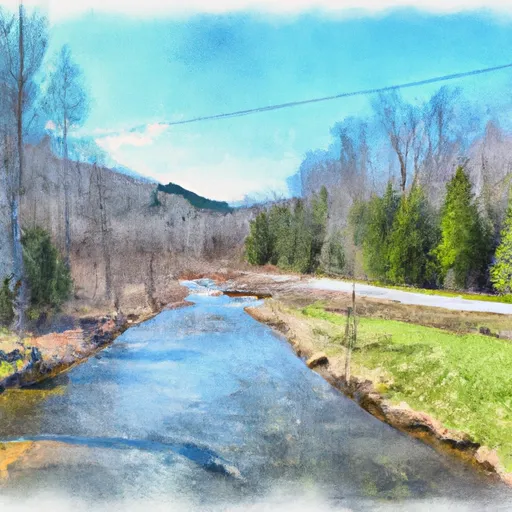
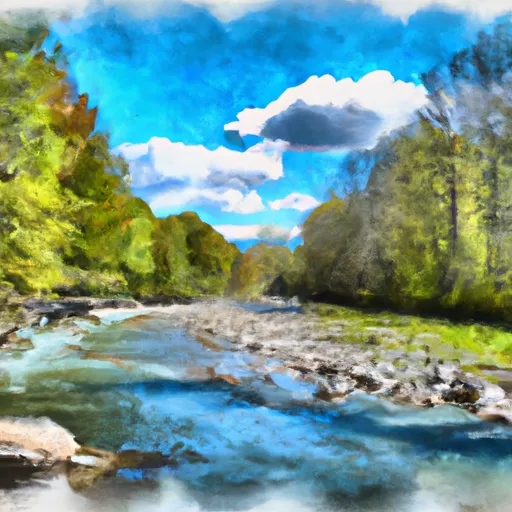
Warren Lake, also known as Blueberry Lake, is a picturesque water resource located in Warren, Vermont. Managed by the local government, this Earth-type dam was completed in 1983 by designer James P. Olson. With a height of 35 feet and a capacity of 1567 acre-feet, Warren Lake serves primarily for recreational purposes and covers a surface area of 48 acres.
Despite its fair condition assessment and high hazard potential, Warren Lake remains a popular destination for outdoor enthusiasts and climate advocates. Set against the backdrop of Mills Brook, this dam plays a crucial role in the local ecosystem while providing opportunities for water-based activities. The dam's structure, consisting of stone core and soil foundations, reflects a harmonious blend of engineering and natural elements that contribute to its aesthetic appeal.
Warren Lake's location within the New England District adds to its significance as a water resource, attracting visitors from near and far to appreciate its beauty and recreational offerings. With state-regulated oversight from Vermont's Department of Environmental Conservation, the dam ensures safe and sustainable water management practices in an ever-changing climate landscape. As climate enthusiasts continue to advocate for responsible stewardship of water resources, Warren Lake stands as a shining example of the delicate balance between human intervention and environmental preservation.
Plan around the weather
Same NOAA / yr.no feed Snoflo's iOS app uses. Watch the precipitation column on the meteogram -- rain on the basin upstream typically lifts inflow 24-72 hours later.
Next 5 days, hour by hour
Temperature line with weather symbols on top, snow + rain accumulation as columns, humidity as a dotted line.
5-day forecast table
Every 3 hours, broken out across temperature, snow, rain, humidity, and wind. Each cell is colour-coded relative to the column min/max.
| Time | Condition | Temp (°F) | Snow (in) | Rain (in) | Humidity (%) | Wind (mps) | Wind dir |
|---|---|---|---|---|---|---|---|
| Loading detailed forecast… | |||||||
15-day temperature & precipitation
Daily temperatures, snow, and rain projected over the next two weeks.
Nearby streamflow gauges
USGS streamgauges around Warren Lake -- inflows here typically show up in storage 24-72 hours later.
| Streamgauge | Discharge | View |
|---|---|---|
| Dog River At Northfield Falls | 33 cfs | → |
| Ayers Brook At Randolph | 14 cfs | → |
| Mad River Near Moretown | 73 cfs | → |
| New Haven River At Brooksville Nr Middlebury | 56 cfs | → |
| Otter Creek At Middlebury | 447 cfs | → |
| Winooski River At Montpelier | 251 cfs | → |


About Warren Lake
Where does the data for Warren Lake come from?
Structural and regulatory data come from the U.S. Army Corps of Engineers' National Inventory of Dams (NID). Weather forecast comes from NOAA / yr.no -- the same feed Snoflo's iOS app uses.
How often is the report updated?
NID structural data refreshes annually as the Corps publishes updated assessments. The weather forecast refreshes throughout the day.
What does the High hazard rating mean?
The Corps of Engineers' hazard potential classification grades probable consequences if the dam fails: High = probable loss of human life; Significant = no probable loss of human life but possible economic loss / environmental damage; Low = no probable loss of human life, only minor economic / environmental losses. See the Dam Data Reference card below for the full definitions.
What's "% of normal"?
The current storage value compared to the historical average storage on this calendar day. 100% = right on average; values above 100% mean above-normal storage (wet year); values below mean below-normal (dry year or drought).
Can I get alerts when storage crosses a threshold?
Yes -- alerts are managed in the Snoflo iOS app. Favorite this dam, set a threshold, and you'll get a push the moment conditions cross.
Dam data reference
Condition Assessment
- Satisfactory
- No existing or potential dam safety deficiencies are recognized. Acceptable performance is expected under all loading conditions (static, hydrologic, seismic) in accordance with the minimum applicable state or federal regulatory criteria or tolerable risk guidelines.
- Fair
- No existing dam safety deficiencies are recognized for normal operating conditions. Rare or extreme hydrologic and/or seismic events may result in a dam safety deficiency. Risk may be in the range to take further action.
- Poor
- A dam safety deficiency is recognized for normal operating conditions which may realistically occur. Remedial action is necessary. POOR may also be used when uncertainties exist as to critical analysis parameters which identify a potential dam safety deficiency.
- Unsatisfactory
- A dam safety deficiency is recognized that requires immediate or emergency remedial action for problem resolution.
- Not Rated
- The dam has not been inspected, is not under state or federal jurisdiction, or has been inspected but, for whatever reason, has not been rated.
Hazard Potential Classification
- High
- Dams assigned the high hazard potential classification are those where failure or mis-operation will probably cause loss of human life.
- Significant
- Dams assigned the significant hazard potential classification are those dams where failure or mis-operation results in no probable loss of human life but can cause economic loss, environmental damage, disruption of lifeline facilities, or impact other concerns. Significant hazard potential classification dams are often located in predominantly rural or agricultural areas but could be in areas with population and significant infrastructure.
- Low
- Dams assigned the low hazard potential classification are those where failure or mis-operation results in no probable loss of human life and low economic and/or environmental losses. Losses are principally limited to the owner's property.
- Undetermined
- Dams for which a downstream hazard potential has not been designated or is not provided.