Sinback Lake Dam Dam

Sinback Lake Dam
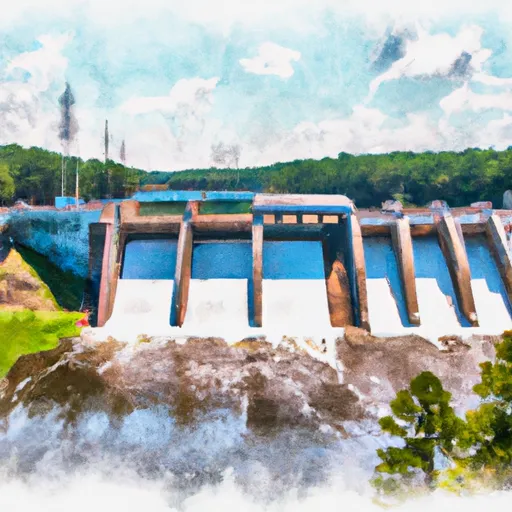
Sinback Lake Dam, located in Hampton, Georgia, is a privately-owned earth dam with a primary purpose of recreation. Built in 1957 by the Soil Conservation Service (SCS), the dam stands at a height of 22 feet and has a storage capacity of 76 acre-feet. The dam spans a length of 310 feet and covers a surface area of 7 acres, with a drainage area of 60 square miles.
Despite being unregulated by the state, Sinback Lake Dam poses a low hazard potential and has a moderate risk rating. The dam features an uncontrolled spillway and outlet gates, with no associated locks. The condition of the dam is currently not rated, and it has not undergone recent inspections. Although the risk assessment is moderate, there are no specific risk management measures in place as of now.
For water resource and climate enthusiasts, Sinback Lake Dam offers a unique recreational opportunity in the heart of Henry County, Georgia. With its picturesque setting and tranquil surroundings, the dam provides a peaceful retreat for nature lovers and outdoor enthusiasts alike. While the dam may not be as well-known as others in the region, its historical significance and potential for future development make it a noteworthy site for those interested in water infrastructure and conservation efforts.
Plan around the weather
Same NOAA / yr.no feed Snoflo's iOS app uses. Watch the precipitation column on the meteogram -- rain on the basin upstream typically lifts inflow 24-72 hours later.
Next 5 days, hour by hour
Temperature line with weather symbols on top, snow + rain accumulation as columns, humidity as a dotted line.
5-day forecast table
Every 3 hours, broken out across temperature, snow, rain, humidity, and wind. Each cell is colour-coded relative to the column min/max.
| Time | Condition | Temp (°F) | Snow (in) | Rain (in) | Humidity (%) | Wind (mps) | Wind dir |
|---|---|---|---|---|---|---|---|
| Loading detailed forecast… | |||||||
15-day temperature & precipitation
Daily temperatures, snow, and rain projected over the next two weeks.
Nearby streamflow gauges
USGS streamgauges around Sinback Lake Dam -- inflows here typically show up in storage 24-72 hours later.
| Streamgauge | Discharge | View |
|---|---|---|
| Flint River Near Lovejoy | 306 cfs | → |
| Pates Creek At Buster Lewis Rd Near Flippen | 18 cfs | → |
| Shoal Creek At Shoal Creek Rd | 6 cfs | → |
| Flint River Near Griffin | 238 cfs | → |
| Line Creek Near Senoia | 13 cfs | → |
| Honey Creek At Ga 212 | 15 cfs | → |


About Sinback Lake Dam
Where does the data for Sinback Lake Dam come from?
Structural and regulatory data come from the U.S. Army Corps of Engineers' National Inventory of Dams (NID). Weather forecast comes from NOAA / yr.no -- the same feed Snoflo's iOS app uses.
How often is the report updated?
NID structural data refreshes annually as the Corps publishes updated assessments. The weather forecast refreshes throughout the day.
What does the Low hazard rating mean?
The Corps of Engineers' hazard potential classification grades probable consequences if the dam fails: High = probable loss of human life; Significant = no probable loss of human life but possible economic loss / environmental damage; Low = no probable loss of human life, only minor economic / environmental losses. See the Dam Data Reference card below for the full definitions.
What's "% of normal"?
The current storage value compared to the historical average storage on this calendar day. 100% = right on average; values above 100% mean above-normal storage (wet year); values below mean below-normal (dry year or drought).
Can I get alerts when storage crosses a threshold?
Yes -- alerts are managed in the Snoflo iOS app. Favorite this dam, set a threshold, and you'll get a push the moment conditions cross.
Dam data reference
Condition Assessment
- Satisfactory
- No existing or potential dam safety deficiencies are recognized. Acceptable performance is expected under all loading conditions (static, hydrologic, seismic) in accordance with the minimum applicable state or federal regulatory criteria or tolerable risk guidelines.
- Fair
- No existing dam safety deficiencies are recognized for normal operating conditions. Rare or extreme hydrologic and/or seismic events may result in a dam safety deficiency. Risk may be in the range to take further action.
- Poor
- A dam safety deficiency is recognized for normal operating conditions which may realistically occur. Remedial action is necessary. POOR may also be used when uncertainties exist as to critical analysis parameters which identify a potential dam safety deficiency.
- Unsatisfactory
- A dam safety deficiency is recognized that requires immediate or emergency remedial action for problem resolution.
- Not Rated
- The dam has not been inspected, is not under state or federal jurisdiction, or has been inspected but, for whatever reason, has not been rated.
Hazard Potential Classification
- High
- Dams assigned the high hazard potential classification are those where failure or mis-operation will probably cause loss of human life.
- Significant
- Dams assigned the significant hazard potential classification are those dams where failure or mis-operation results in no probable loss of human life but can cause economic loss, environmental damage, disruption of lifeline facilities, or impact other concerns. Significant hazard potential classification dams are often located in predominantly rural or agricultural areas but could be in areas with population and significant infrastructure.
- Low
- Dams assigned the low hazard potential classification are those where failure or mis-operation results in no probable loss of human life and low economic and/or environmental losses. Losses are principally limited to the owner's property.
- Undetermined
- Dams for which a downstream hazard potential has not been designated or is not provided.