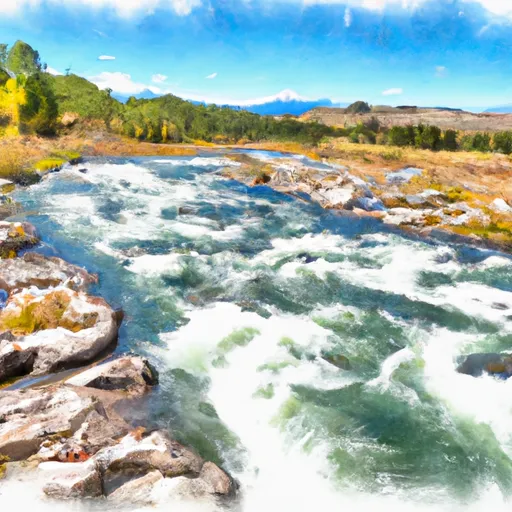
Morony Dam

Morony
Morony Dam, located in Fort Benton, Montana, is a gravity dam constructed in 1929 primarily for hydroelectric purposes on the Missouri River. With a height of 70 feet and a hydraulic height of 93 feet, the dam boasts a structural height of 107 feet and a total length of 842 feet. It has a storage capacity of 13,889 acre-feet and a maximum discharge of 153,000 cubic feet per second, making it a crucial infrastructure for water resource management in the region.
Managed by a private entity, Morony Dam is regulated by the Federal Energy Regulatory Commission and undergoes regular inspections to ensure its safety and operational integrity. The dam's controlled spillway, with a width of 306 feet, mitigates flood risks in the area, although it is classified as having a high hazard potential. Despite its age, the dam's risk assessment remains at a very high level, emphasizing the importance of continued monitoring and maintenance to prevent potential disasters and ensure the sustainability of the surrounding environment and communities.
The dam's association with renowned designers Electric Bond and Share/Charles T. Main highlights its historical significance and engineering excellence. Its critical role in hydroelectric power generation and water storage underscores its importance in supporting regional water resource management efforts and climate resilience initiatives. As water resource and climate enthusiasts, understanding the complexities of infrastructure like Morony Dam is essential for promoting sustainable development and safeguarding our natural resources for future generations.
Plan around the weather
Same NOAA / yr.no feed Snoflo's iOS app uses. Watch the precipitation column on the meteogram -- rain on the basin upstream typically lifts inflow 24-72 hours later.
Next 5 days, hour by hour
Temperature line with weather symbols on top, snow + rain accumulation as columns, humidity as a dotted line.
5-day forecast table
Every 3 hours, broken out across temperature, snow, rain, humidity, and wind. Each cell is colour-coded relative to the column min/max.
| Time | Condition | Temp (°F) | Snow (in) | Rain (in) | Humidity (%) | Wind (mps) | Wind dir |
|---|---|---|---|---|---|---|---|
| Loading detailed forecast… | |||||||
15-day temperature & precipitation
Daily temperatures, snow, and rain projected over the next two weeks.
Nearby streamflow gauges
USGS streamgauges around Morony -- inflows here typically show up in storage 24-72 hours later.
| Streamgauge | Discharge | View |
|---|---|---|
| Missouri River Near Great Falls Mt | 4,420 cfs | → |
| Missouri River Near Ulm Mt | 3,320 cfs | → |
| Lake Creek Near Power Mt | 30 cfs | → |
| Sun River Near Vaughn Mt | 641 cfs | → |
| Muddy Creek At Vaughn Mt | 253 cfs | → |
| Missouri River At Fort Benton Mt | 4,860 cfs | → |


About Morony
Where does the data for Morony come from?
Structural and regulatory data come from the U.S. Army Corps of Engineers' National Inventory of Dams (NID). Weather forecast comes from NOAA / yr.no -- the same feed Snoflo's iOS app uses.
How often is the report updated?
NID structural data refreshes annually as the Corps publishes updated assessments. The weather forecast refreshes throughout the day.
What does the High hazard rating mean?
The Corps of Engineers' hazard potential classification grades probable consequences if the dam fails: High = probable loss of human life; Significant = no probable loss of human life but possible economic loss / environmental damage; Low = no probable loss of human life, only minor economic / environmental losses. See the Dam Data Reference card below for the full definitions.
What's "% of normal"?
The current storage value compared to the historical average storage on this calendar day. 100% = right on average; values above 100% mean above-normal storage (wet year); values below mean below-normal (dry year or drought).
Can I get alerts when storage crosses a threshold?
Yes -- alerts are managed in the Snoflo iOS app. Favorite this dam, set a threshold, and you'll get a push the moment conditions cross.
Dam data reference
Condition Assessment
- Satisfactory
- No existing or potential dam safety deficiencies are recognized. Acceptable performance is expected under all loading conditions (static, hydrologic, seismic) in accordance with the minimum applicable state or federal regulatory criteria or tolerable risk guidelines.
- Fair
- No existing dam safety deficiencies are recognized for normal operating conditions. Rare or extreme hydrologic and/or seismic events may result in a dam safety deficiency. Risk may be in the range to take further action.
- Poor
- A dam safety deficiency is recognized for normal operating conditions which may realistically occur. Remedial action is necessary. POOR may also be used when uncertainties exist as to critical analysis parameters which identify a potential dam safety deficiency.
- Unsatisfactory
- A dam safety deficiency is recognized that requires immediate or emergency remedial action for problem resolution.
- Not Rated
- The dam has not been inspected, is not under state or federal jurisdiction, or has been inspected but, for whatever reason, has not been rated.
Hazard Potential Classification
- High
- Dams assigned the high hazard potential classification are those where failure or mis-operation will probably cause loss of human life.
- Significant
- Dams assigned the significant hazard potential classification are those dams where failure or mis-operation results in no probable loss of human life but can cause economic loss, environmental damage, disruption of lifeline facilities, or impact other concerns. Significant hazard potential classification dams are often located in predominantly rural or agricultural areas but could be in areas with population and significant infrastructure.
- Low
- Dams assigned the low hazard potential classification are those where failure or mis-operation results in no probable loss of human life and low economic and/or environmental losses. Losses are principally limited to the owner's property.
- Undetermined
- Dams for which a downstream hazard potential has not been designated or is not provided.