Hidden Lake Dam

Hidden Lake Dam
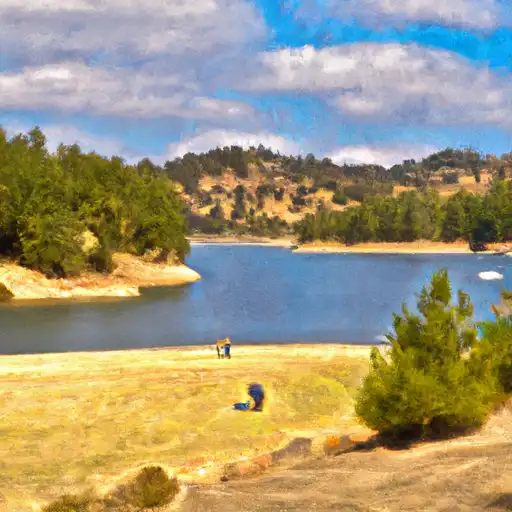
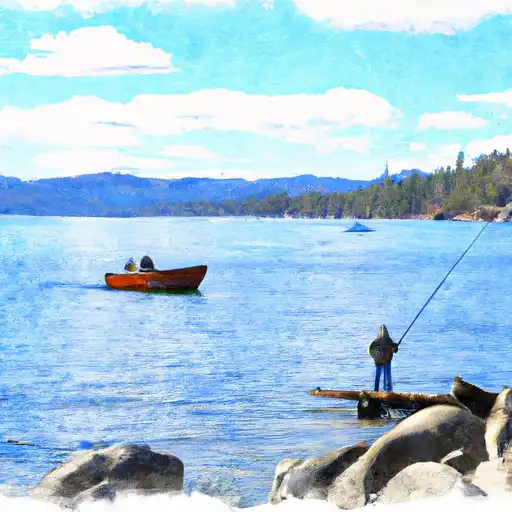
Hidden Lake Dam, nestled in Washoe County, Nevada, near Reno, is a private earth dam primarily designed for recreational purposes. Constructed in 1990 by Sierra Nevada Construction Consultants, the dam stands at a height of 15 feet and a length of 3581 feet, with a hydraulic height of 13 feet. It boasts a storage capacity of 135 acre-feet, serving as a picturesque destination for water resource and climate enthusiasts.
With a spillway width of 60 feet and a maximum discharge of 290 cubic feet per second, Hidden Lake Dam is equipped with controlled outlet gates to manage water flow. The dam's condition is assessed as fair, with a low hazard potential and a moderate risk rating of 3. Although the dam is not federally owned or funded, it is regulated by the Nevada Department of Water Resources, ensuring its safety and compliance with state inspection and enforcement protocols.
Hidden Lake Dam offers a tranquil setting for outdoor activities, providing a surface area of 13.2 acres and a normal storage capacity of 95.9 acre-feet. Despite its low hazard potential, the dam's risk management measures and emergency action plans are crucial for ensuring the safety of the surrounding community and the preservation of its natural beauty. As a key feature in the Streamboat Creek watershed, Hidden Lake Dam serves as a valuable resource for both recreational enjoyment and water management in the region.
Plan around the weather
Same NOAA / yr.no feed Snoflo's iOS app uses. Watch the precipitation column on the meteogram -- rain on the basin upstream typically lifts inflow 24-72 hours later.
Next 5 days, hour by hour
Temperature line with weather symbols on top, snow + rain accumulation as columns, humidity as a dotted line.
5-day forecast table
Every 3 hours, broken out across temperature, snow, rain, humidity, and wind. Each cell is colour-coded relative to the column min/max.
| Time | Condition | Temp (°F) | Snow (in) | Rain (in) | Humidity (%) | Wind (mps) | Wind dir |
|---|---|---|---|---|---|---|---|
| Loading detailed forecast… | |||||||
15-day temperature & precipitation
Daily temperatures, snow, and rain projected over the next two weeks.
Nearby streamflow gauges
USGS streamgauges around Hidden Lake Dam -- inflows here typically show up in storage 24-72 hours later.
| Streamgauge | Discharge | View |
|---|---|---|
| Steamboat C At Steamboat | · | → |
| Galena C At Galena C State Park | 15 cfs | → |
| Steamboat Ck At Short Ln At Reno | 5 cfs | → |
| Steamboat C At Cleanwater Way Nr Reno | 20 cfs | → |
| Truckee R Nr Sparks | 304 cfs | → |
| Truckee R At Vista | 273 cfs | → |


About Hidden Lake Dam
Where does the data for Hidden Lake Dam come from?
Structural and regulatory data come from the U.S. Army Corps of Engineers' National Inventory of Dams (NID). Weather forecast comes from NOAA / yr.no -- the same feed Snoflo's iOS app uses.
How often is the report updated?
NID structural data refreshes annually as the Corps publishes updated assessments. The weather forecast refreshes throughout the day.
What does the Low hazard rating mean?
The Corps of Engineers' hazard potential classification grades probable consequences if the dam fails: High = probable loss of human life; Significant = no probable loss of human life but possible economic loss / environmental damage; Low = no probable loss of human life, only minor economic / environmental losses. See the Dam Data Reference card below for the full definitions.
What's "% of normal"?
The current storage value compared to the historical average storage on this calendar day. 100% = right on average; values above 100% mean above-normal storage (wet year); values below mean below-normal (dry year or drought).
Can I get alerts when storage crosses a threshold?
Yes -- alerts are managed in the Snoflo iOS app. Favorite this dam, set a threshold, and you'll get a push the moment conditions cross.
Dam data reference
Condition Assessment
- Satisfactory
- No existing or potential dam safety deficiencies are recognized. Acceptable performance is expected under all loading conditions (static, hydrologic, seismic) in accordance with the minimum applicable state or federal regulatory criteria or tolerable risk guidelines.
- Fair
- No existing dam safety deficiencies are recognized for normal operating conditions. Rare or extreme hydrologic and/or seismic events may result in a dam safety deficiency. Risk may be in the range to take further action.
- Poor
- A dam safety deficiency is recognized for normal operating conditions which may realistically occur. Remedial action is necessary. POOR may also be used when uncertainties exist as to critical analysis parameters which identify a potential dam safety deficiency.
- Unsatisfactory
- A dam safety deficiency is recognized that requires immediate or emergency remedial action for problem resolution.
- Not Rated
- The dam has not been inspected, is not under state or federal jurisdiction, or has been inspected but, for whatever reason, has not been rated.
Hazard Potential Classification
- High
- Dams assigned the high hazard potential classification are those where failure or mis-operation will probably cause loss of human life.
- Significant
- Dams assigned the significant hazard potential classification are those dams where failure or mis-operation results in no probable loss of human life but can cause economic loss, environmental damage, disruption of lifeline facilities, or impact other concerns. Significant hazard potential classification dams are often located in predominantly rural or agricultural areas but could be in areas with population and significant infrastructure.
- Low
- Dams assigned the low hazard potential classification are those where failure or mis-operation results in no probable loss of human life and low economic and/or environmental losses. Losses are principally limited to the owner's property.
- Undetermined
- Dams for which a downstream hazard potential has not been designated or is not provided.