Howe Reservoir Dam Dam

Howe Reservoir Dam
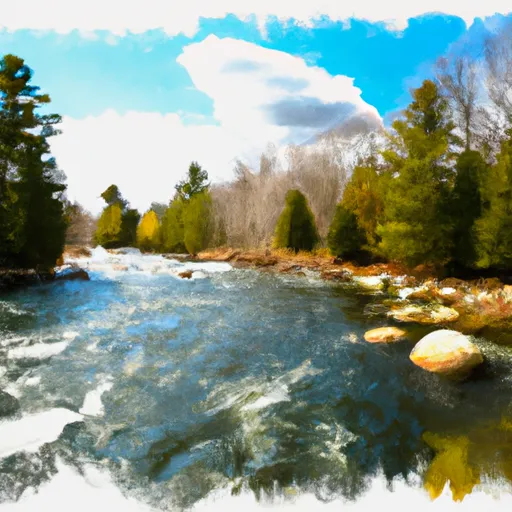
Howe Reservoir Dam in Harrisville, New Hampshire, stands as a testament to the state's commitment to recreation and water resource management. Completed in 1924, this earth dam spans 157 feet in length and reaches a height of 28 feet, providing storage of up to 2086 acre-feet. The reservoir itself covers 208 acres and is fed by the serene TR Minnewawa Brook, offering a picturesque setting for outdoor enthusiasts.
Despite its significant contributions to water storage and recreational activities, Howe Reservoir Dam faces challenges in terms of its maintenance and condition. With a hazard potential rated as high and a poor condition assessment, the dam requires regular inspections and enforcement by the NHDES DAM BUREAU to ensure public safety. The risk assessment for the dam is moderate, indicating the need for ongoing risk management measures to mitigate potential hazards and safeguard the surrounding communities.
As climate change continues to impact water resources and infrastructure, Howe Reservoir Dam serves as a vital reminder of the importance of proactive management and investment in maintaining the integrity of our dams. With its historical significance and recreational value, this dam stands as a symbol of New Hampshire's commitment to balancing water resource utilization with environmental preservation in the face of evolving climate conditions.
Plan around the weather
Same NOAA / yr.no feed Snoflo's iOS app uses. Watch the precipitation column on the meteogram -- rain on the basin upstream typically lifts inflow 24-72 hours later.
Next 5 days, hour by hour
Temperature line with weather symbols on top, snow + rain accumulation as columns, humidity as a dotted line.
5-day forecast table
Every 3 hours, broken out across temperature, snow, rain, humidity, and wind. Each cell is colour-coded relative to the column min/max.
| Time | Condition | Temp (°F) | Snow (in) | Rain (in) | Humidity (%) | Wind (mps) | Wind dir |
|---|---|---|---|---|---|---|---|
| Loading detailed forecast… | |||||||
15-day temperature & precipitation
Daily temperatures, snow, and rain projected over the next two weeks.
Nearby streamflow gauges
USGS streamgauges around Howe Reservoir Dam -- inflows here typically show up in storage 24-72 hours later.
| Streamgauge | Discharge | View |
|---|---|---|
| Otter Brook Below Otter Brook Dam | 12 cfs | → |
| S Br Ashuelot River At Webb | 25 cfs | → |
| Ashuelot River Above The Branch | 21 cfs | → |
| Nubanusit Bk Blw Macdowell Dam Nr Peterborough Nh | 31 cfs | → |
| Contoocook River At Peterborough | 14 cfs | → |
| Ashuelot River Below Surry Mt Dam | 16 cfs | → |
Make a day of it
Boat launches, lakeside camping, fishing access, and other reservoirs near Howe Reservoir Dam.
Boat launches
See all →


Campgrounds
See all →


Fishing spots
See all →
River runs
See all →


More reservoirs
See all →
About Howe Reservoir Dam
Where does the data for Howe Reservoir Dam come from?
Structural and regulatory data come from the U.S. Army Corps of Engineers' National Inventory of Dams (NID). Weather forecast comes from NOAA / yr.no -- the same feed Snoflo's iOS app uses.
How often is the report updated?
NID structural data refreshes annually as the Corps publishes updated assessments. The weather forecast refreshes throughout the day.
What does the High hazard rating mean?
The Corps of Engineers' hazard potential classification grades probable consequences if the dam fails: High = probable loss of human life; Significant = no probable loss of human life but possible economic loss / environmental damage; Low = no probable loss of human life, only minor economic / environmental losses. See the Dam Data Reference card below for the full definitions.
What's "% of normal"?
The current storage value compared to the historical average storage on this calendar day. 100% = right on average; values above 100% mean above-normal storage (wet year); values below mean below-normal (dry year or drought).
Can I get alerts when storage crosses a threshold?
Yes -- alerts are managed in the Snoflo iOS app. Favorite this dam, set a threshold, and you'll get a push the moment conditions cross.
Dam data reference
Condition Assessment
- Satisfactory
- No existing or potential dam safety deficiencies are recognized. Acceptable performance is expected under all loading conditions (static, hydrologic, seismic) in accordance with the minimum applicable state or federal regulatory criteria or tolerable risk guidelines.
- Fair
- No existing dam safety deficiencies are recognized for normal operating conditions. Rare or extreme hydrologic and/or seismic events may result in a dam safety deficiency. Risk may be in the range to take further action.
- Poor
- A dam safety deficiency is recognized for normal operating conditions which may realistically occur. Remedial action is necessary. POOR may also be used when uncertainties exist as to critical analysis parameters which identify a potential dam safety deficiency.
- Unsatisfactory
- A dam safety deficiency is recognized that requires immediate or emergency remedial action for problem resolution.
- Not Rated
- The dam has not been inspected, is not under state or federal jurisdiction, or has been inspected but, for whatever reason, has not been rated.
Hazard Potential Classification
- High
- Dams assigned the high hazard potential classification are those where failure or mis-operation will probably cause loss of human life.
- Significant
- Dams assigned the significant hazard potential classification are those dams where failure or mis-operation results in no probable loss of human life but can cause economic loss, environmental damage, disruption of lifeline facilities, or impact other concerns. Significant hazard potential classification dams are often located in predominantly rural or agricultural areas but could be in areas with population and significant infrastructure.
- Low
- Dams assigned the low hazard potential classification are those where failure or mis-operation results in no probable loss of human life and low economic and/or environmental losses. Losses are principally limited to the owner's property.
- Undetermined
- Dams for which a downstream hazard potential has not been designated or is not provided.