Beverly Crest Dam dam

Beverly Crest Dam
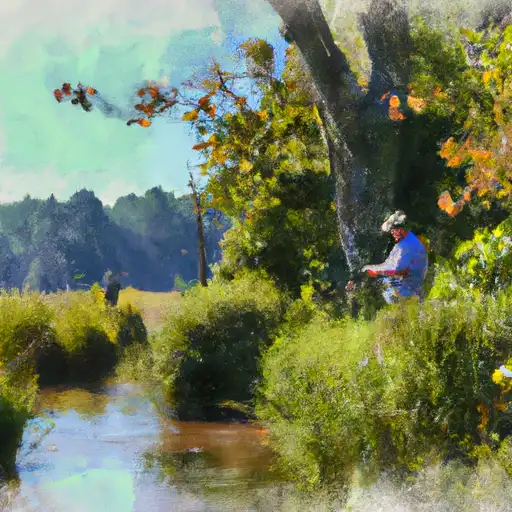
Beverly Crest Dam, located in Charlotte, North Carolina, stands as a private water resource structure along Mcalpine Creek. The dam serves primarily for recreational purposes, offering a serene five-acre surface area for visitors to enjoy. With a hydraulic height of 17.9 feet and a structural height of 24.9 feet, the dam holds a total of 460 acre-feet of storage, making it a significant asset for water management in the region.
Managed and regulated by the North Carolina Department of Environmental Quality's Dam Safety Program, Beverly Crest Dam has been deemed to have a high hazard potential due to its location and size. Despite this classification, the dam's condition assessment in February 2020 reported it to be in satisfactory condition. Regular inspections are conducted every two years to ensure the dam's structural integrity and safety measures are up to standard, with emergency action plans in place should the need arise.
As an essential part of Mecklenburg County's water infrastructure, Beverly Crest Dam serves not only as a recreational spot but also as a crucial element in managing the water flow of Mcalpine Creek. With its significant storage capacity and regulated maintenance schedule, the dam stands as a testament to effective water resource management in the region, ensuring both safety and enjoyment for residents and visitors alike.
Plan around the weather
Same NOAA / yr.no feed Snoflo's iOS app uses. Watch the precipitation column on the meteogram -- rain on the basin upstream typically lifts inflow 24-72 hours later.
Next 5 days, hour by hour
Temperature line with weather symbols on top, snow + rain accumulation as columns, humidity as a dotted line.
5-day forecast table
Every 3 hours, broken out across temperature, snow, rain, humidity, and wind. Each cell is colour-coded relative to the column min/max.
| Time | Condition | Temp (°F) | Snow (in) | Rain (in) | Humidity (%) | Wind (mps) | Wind dir |
|---|---|---|---|---|---|---|---|
| Loading detailed forecast… | |||||||
15-day temperature & precipitation
Daily temperatures, snow, and rain projected over the next two weeks.
Nearby streamflow gauges
USGS streamgauges around Beverly Crest Dam -- inflows here typically show up in storage 24-72 hours later.
| Streamgauge | Discharge | View |
|---|---|---|
| Mcalpine Cr At Sardis Road Near Charlotte | 28 cfs | → |
| Mcmullen Cr At Sharon View Rd Near Charlotte | 5 cfs | → |
| Four Mile Creek Near Pineville | 4 cfs | → |
| Little Sugar C At Archdale Dr At Charlotte | 29 cfs | → |
| Mcalpine Creek At Sr3150 Nr Idlewild | 1 cfs | → |
| Briar Cr Above Colony Rd At Charlotte | 6 cfs | → |


About Beverly Crest Dam
Where does the data for Beverly Crest Dam come from?
Structural and regulatory data come from the U.S. Army Corps of Engineers' National Inventory of Dams (NID). Weather forecast comes from NOAA / yr.no -- the same feed Snoflo's iOS app uses.
How often is the report updated?
NID structural data refreshes annually as the Corps publishes updated assessments. The weather forecast refreshes throughout the day.
What does the High hazard rating mean?
The Corps of Engineers' hazard potential classification grades probable consequences if the dam fails: High = probable loss of human life; Significant = no probable loss of human life but possible economic loss / environmental damage; Low = no probable loss of human life, only minor economic / environmental losses. See the Dam Data Reference card below for the full definitions.
What's "% of normal"?
The current storage value compared to the historical average storage on this calendar day. 100% = right on average; values above 100% mean above-normal storage (wet year); values below mean below-normal (dry year or drought).
Can I get alerts when storage crosses a threshold?
Yes -- alerts are managed in the Snoflo iOS app. Favorite this dam, set a threshold, and you'll get a push the moment conditions cross.
Dam data reference
Condition Assessment
- Satisfactory
- No existing or potential dam safety deficiencies are recognized. Acceptable performance is expected under all loading conditions (static, hydrologic, seismic) in accordance with the minimum applicable state or federal regulatory criteria or tolerable risk guidelines.
- Fair
- No existing dam safety deficiencies are recognized for normal operating conditions. Rare or extreme hydrologic and/or seismic events may result in a dam safety deficiency. Risk may be in the range to take further action.
- Poor
- A dam safety deficiency is recognized for normal operating conditions which may realistically occur. Remedial action is necessary. POOR may also be used when uncertainties exist as to critical analysis parameters which identify a potential dam safety deficiency.
- Unsatisfactory
- A dam safety deficiency is recognized that requires immediate or emergency remedial action for problem resolution.
- Not Rated
- The dam has not been inspected, is not under state or federal jurisdiction, or has been inspected but, for whatever reason, has not been rated.
Hazard Potential Classification
- High
- Dams assigned the high hazard potential classification are those where failure or mis-operation will probably cause loss of human life.
- Significant
- Dams assigned the significant hazard potential classification are those dams where failure or mis-operation results in no probable loss of human life but can cause economic loss, environmental damage, disruption of lifeline facilities, or impact other concerns. Significant hazard potential classification dams are often located in predominantly rural or agricultural areas but could be in areas with population and significant infrastructure.
- Low
- Dams assigned the low hazard potential classification are those where failure or mis-operation results in no probable loss of human life and low economic and/or environmental losses. Losses are principally limited to the owner's property.
- Undetermined
- Dams for which a downstream hazard potential has not been designated or is not provided.