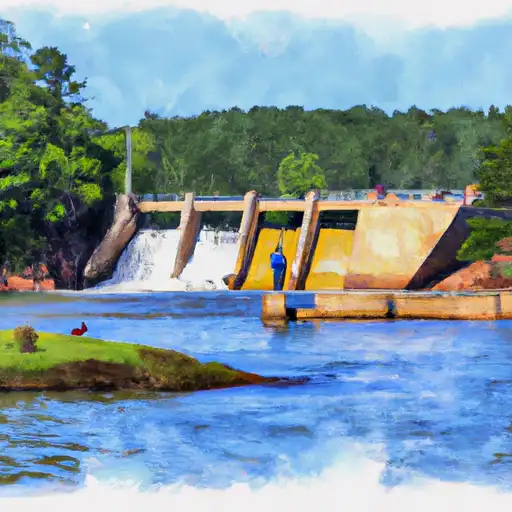
Lake Crabtree dam

Lake Crabtree
Lake Crabtree, located in Wake County, North Carolina, serves as a vital flood risk reduction structure along Crabtree Creek. Constructed in 1988 by the USDA NRCS, this earth dam with a stone core stands at a structural height of 45 feet, holding back a maximum storage capacity of 8,950 acre-feet. With a surface area of 473 acres and a drainage area of 33,178 square miles, Lake Crabtree plays a crucial role in protecting the surrounding areas from potential flooding events.
In addition to its flood risk reduction function, Lake Crabtree also offers recreational opportunities for visitors to enjoy. Boasting a normal storage capacity of 2,040 acre-feet, the reservoir provides a picturesque setting for activities such as fishing, boating, and wildlife observation. Despite its high hazard potential, the dam's satisfactory condition assessment and regular inspections ensure its continued safety and effectiveness in managing water resources in the region.
Managed by the NCDEQ Dam Safety Program, Lake Crabtree remains a key feature in the local water resource infrastructure. With its uncontrolled spillway and outlet gates, the dam is equipped to handle moderate risk levels and emergency situations. As a significant structure in the region's water management system, Lake Crabtree stands as a testament to the importance of sustainable practices in climate resilience and flood prevention.
Plan around the weather
Same NOAA / yr.no feed Snoflo's iOS app uses. Watch the precipitation column on the meteogram -- rain on the basin upstream typically lifts inflow 24-72 hours later.
Next 5 days, hour by hour
Temperature line with weather symbols on top, snow + rain accumulation as columns, humidity as a dotted line.
5-day forecast table
Every 3 hours, broken out across temperature, snow, rain, humidity, and wind. Each cell is colour-coded relative to the column min/max.
| Time | Condition | Temp (°F) | Snow (in) | Rain (in) | Humidity (%) | Wind (mps) | Wind dir |
|---|---|---|---|---|---|---|---|
| Loading detailed forecast… | |||||||
15-day temperature & precipitation
Daily temperatures, snow, and rain projected over the next two weeks.
Nearby streamflow gauges
USGS streamgauges around Lake Crabtree -- inflows here typically show up in storage 24-72 hours later.
| Streamgauge | Discharge | View |
|---|---|---|
| Crabtree Cr At Ebenezer Church Rd Nr Raleigh | 51 cfs | → |
| Crabtree Creek At Hwy 70 At Raleigh | 67 cfs | → |
| Northeast Creek At Sr1100 Nr Genlee | 5 cfs | → |
| Rocky Branch Below Pullen Drive At Raleigh | 1 cfs | → |
| Swift Creek Near Apex | · | → |
| White Oak Cr At Mouth Near Green Level | · | → |


About Lake Crabtree
Where does the data for Lake Crabtree come from?
Structural and regulatory data come from the U.S. Army Corps of Engineers' National Inventory of Dams (NID). Weather forecast comes from NOAA / yr.no -- the same feed Snoflo's iOS app uses.
How often is the report updated?
NID structural data refreshes annually as the Corps publishes updated assessments. The weather forecast refreshes throughout the day.
What does the High hazard rating mean?
The Corps of Engineers' hazard potential classification grades probable consequences if the dam fails: High = probable loss of human life; Significant = no probable loss of human life but possible economic loss / environmental damage; Low = no probable loss of human life, only minor economic / environmental losses. See the Dam Data Reference card below for the full definitions.
What's "% of normal"?
The current storage value compared to the historical average storage on this calendar day. 100% = right on average; values above 100% mean above-normal storage (wet year); values below mean below-normal (dry year or drought).
Can I get alerts when storage crosses a threshold?
Yes -- alerts are managed in the Snoflo iOS app. Favorite this dam, set a threshold, and you'll get a push the moment conditions cross.
Dam data reference
Condition Assessment
- Satisfactory
- No existing or potential dam safety deficiencies are recognized. Acceptable performance is expected under all loading conditions (static, hydrologic, seismic) in accordance with the minimum applicable state or federal regulatory criteria or tolerable risk guidelines.
- Fair
- No existing dam safety deficiencies are recognized for normal operating conditions. Rare or extreme hydrologic and/or seismic events may result in a dam safety deficiency. Risk may be in the range to take further action.
- Poor
- A dam safety deficiency is recognized for normal operating conditions which may realistically occur. Remedial action is necessary. POOR may also be used when uncertainties exist as to critical analysis parameters which identify a potential dam safety deficiency.
- Unsatisfactory
- A dam safety deficiency is recognized that requires immediate or emergency remedial action for problem resolution.
- Not Rated
- The dam has not been inspected, is not under state or federal jurisdiction, or has been inspected but, for whatever reason, has not been rated.
Hazard Potential Classification
- High
- Dams assigned the high hazard potential classification are those where failure or mis-operation will probably cause loss of human life.
- Significant
- Dams assigned the significant hazard potential classification are those dams where failure or mis-operation results in no probable loss of human life but can cause economic loss, environmental damage, disruption of lifeline facilities, or impact other concerns. Significant hazard potential classification dams are often located in predominantly rural or agricultural areas but could be in areas with population and significant infrastructure.
- Low
- Dams assigned the low hazard potential classification are those where failure or mis-operation results in no probable loss of human life and low economic and/or environmental losses. Losses are principally limited to the owner's property.
- Undetermined
- Dams for which a downstream hazard potential has not been designated or is not provided.