Spalding Dam Dam

Spalding Dam
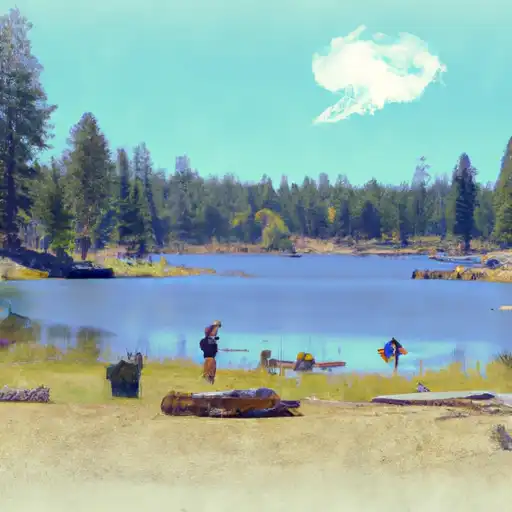
Spalding Dam, located in Josephine County, Oregon, is a vital structure managed by the Forest Service for the primary purpose of creating a Fish and Wildlife Pond. Completed in 1990, this Earth dam stands at a height of 37 feet and has a storage capacity of 25 acre-feet. Situated on Soldier Creek, the dam serves as a recreational area and habitat for various wildlife species in the region.
With a low hazard potential and a moderate risk assessment rating, Spalding Dam is considered a crucial component of the local ecosystem. The dam features an uncontrolled spillway and outlet gates, ensuring proper water flow and management. The Forest Service conducts regular inspections and maintenance to uphold the dam's structural integrity and ensure its continued functionality for the surrounding environment and community.
Visitors to Spalding Dam can enjoy the serene surroundings of the Fish and Wildlife Pond while appreciating the efforts put forth by the Forest Service to maintain this important water resource. As climate and water resource enthusiasts, understanding the role of structures like Spalding Dam in preserving ecosystems and supporting wildlife can deepen our appreciation for the interconnectedness of water management and environmental conservation efforts.
Plan around the weather
Same NOAA / yr.no feed Snoflo's iOS app uses. Watch the precipitation column on the meteogram -- rain on the basin upstream typically lifts inflow 24-72 hours later.
Next 5 days, hour by hour
Temperature line with weather symbols on top, snow + rain accumulation as columns, humidity as a dotted line.
5-day forecast table
Every 3 hours, broken out across temperature, snow, rain, humidity, and wind. Each cell is colour-coded relative to the column min/max.
| Time | Condition | Temp (°F) | Snow (in) | Rain (in) | Humidity (%) | Wind (mps) | Wind dir |
|---|---|---|---|---|---|---|---|
| Loading detailed forecast… | |||||||
15-day temperature & precipitation
Daily temperatures, snow, and rain projected over the next two weeks.
Nearby streamflow gauges
USGS streamgauges around Spalding Dam -- inflows here typically show up in storage 24-72 hours later.
| Streamgauge | Discharge | View |
|---|---|---|
| Illinois River Near Kerby | 33 cfs | → |
| Applegate River Near Wilderville | 42 cfs | → |
| Sucker Cr Bl Lt Grayback Cr Nr Holland | 23 cfs | → |
| Rogue River At Grants Pass | 1,190 cfs | → |
| Rogue River Near Agness | 1,410 cfs | → |
| Chetco River Near Brookings | 87 cfs | → |
Make a day of it
Boat launches, lakeside camping, fishing access, and other reservoirs near Spalding Dam.
Boat launches
See all →


Campgrounds
See all →


Fishing spots
See all →


River runs
See all →

More reservoirs
See all →
About Spalding Dam
Where does the data for Spalding Dam come from?
Structural and regulatory data come from the U.S. Army Corps of Engineers' National Inventory of Dams (NID). Weather forecast comes from NOAA / yr.no -- the same feed Snoflo's iOS app uses.
How often is the report updated?
NID structural data refreshes annually as the Corps publishes updated assessments. The weather forecast refreshes throughout the day.
What does the Low hazard rating mean?
The Corps of Engineers' hazard potential classification grades probable consequences if the dam fails: High = probable loss of human life; Significant = no probable loss of human life but possible economic loss / environmental damage; Low = no probable loss of human life, only minor economic / environmental losses. See the Dam Data Reference card below for the full definitions.
What's "% of normal"?
The current storage value compared to the historical average storage on this calendar day. 100% = right on average; values above 100% mean above-normal storage (wet year); values below mean below-normal (dry year or drought).
Can I get alerts when storage crosses a threshold?
Yes -- alerts are managed in the Snoflo iOS app. Favorite this dam, set a threshold, and you'll get a push the moment conditions cross.
Dam data reference
Condition Assessment
- Satisfactory
- No existing or potential dam safety deficiencies are recognized. Acceptable performance is expected under all loading conditions (static, hydrologic, seismic) in accordance with the minimum applicable state or federal regulatory criteria or tolerable risk guidelines.
- Fair
- No existing dam safety deficiencies are recognized for normal operating conditions. Rare or extreme hydrologic and/or seismic events may result in a dam safety deficiency. Risk may be in the range to take further action.
- Poor
- A dam safety deficiency is recognized for normal operating conditions which may realistically occur. Remedial action is necessary. POOR may also be used when uncertainties exist as to critical analysis parameters which identify a potential dam safety deficiency.
- Unsatisfactory
- A dam safety deficiency is recognized that requires immediate or emergency remedial action for problem resolution.
- Not Rated
- The dam has not been inspected, is not under state or federal jurisdiction, or has been inspected but, for whatever reason, has not been rated.
Hazard Potential Classification
- High
- Dams assigned the high hazard potential classification are those where failure or mis-operation will probably cause loss of human life.
- Significant
- Dams assigned the significant hazard potential classification are those dams where failure or mis-operation results in no probable loss of human life but can cause economic loss, environmental damage, disruption of lifeline facilities, or impact other concerns. Significant hazard potential classification dams are often located in predominantly rural or agricultural areas but could be in areas with population and significant infrastructure.
- Low
- Dams assigned the low hazard potential classification are those where failure or mis-operation results in no probable loss of human life and low economic and/or environmental losses. Losses are principally limited to the owner's property.
- Undetermined
- Dams for which a downstream hazard potential has not been designated or is not provided.