Loughridge Lake Dam Dam

Loughridge Lake Dam
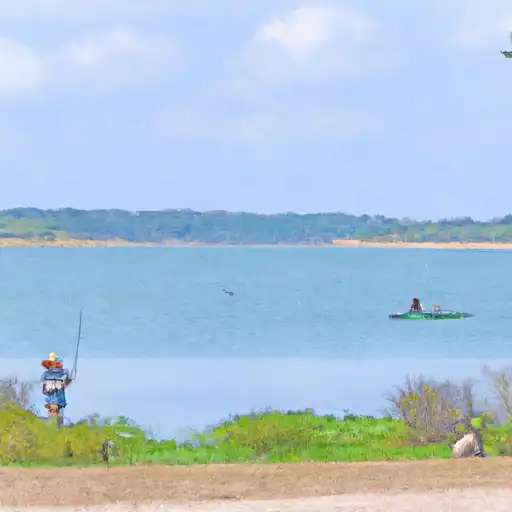
Loughridge Lake Dam, located in Tarrant County, Texas, stands as a testament to water conservation and recreational opportunities in the region. Completed in 1955, this earth dam with a buttress core type reaches a height of 17 feet and spans a length of 770 feet, creating a reservoir with a maximum storage capacity of 299 acre-feet. While primarily serving recreational purposes, the dam also plays a crucial role in flood control along Big Fossil Creek.
Managed by a private owner and regulated by the Texas Commission on Environmental Quality (TCEQ), Loughridge Lake Dam maintains a fair condition assessment as of April 2021. With a high hazard potential and a risk level of 2, continuous risk management measures are imperative to ensure the safety and integrity of the structure. Despite lacking certain features like a spillway, the dam has withstood the test of time and remains a key feature in the local landscape, attracting water resource and climate enthusiasts alike.
As water resource enthusiasts explore the history and significance of Loughridge Lake Dam, they can appreciate its role in providing water storage and recreational opportunities while managing flood risks. With its location in the Fort Worth District and oversight from the TCEQ, the dam stands as a symbol of human innovation and engineering in harmony with the natural environment. The ongoing conservation efforts and risk assessments ensure that Loughridge Lake Dam continues to serve its purpose effectively, contributing to the sustainability of water resources in the region.
Plan around the weather
Same NOAA / yr.no feed Snoflo's iOS app uses. Watch the precipitation column on the meteogram -- rain on the basin upstream typically lifts inflow 24-72 hours later.
Next 5 days, hour by hour
Temperature line with weather symbols on top, snow + rain accumulation as columns, humidity as a dotted line.
5-day forecast table
Every 3 hours, broken out across temperature, snow, rain, humidity, and wind. Each cell is colour-coded relative to the column min/max.
| Time | Condition | Temp (°F) | Snow (in) | Rain (in) | Humidity (%) | Wind (mps) | Wind dir |
|---|---|---|---|---|---|---|---|
| Loading detailed forecast… | |||||||
15-day temperature & precipitation
Daily temperatures, snow, and rain projected over the next two weeks.
Nearby streamflow gauges
USGS streamgauges around Loughridge Lake Dam -- inflows here typically show up in storage 24-72 hours later.
| Streamgauge | Discharge | View |
|---|---|---|
| Big Fossil Ck At Haltom City | · | → |
| W Fk Trinity Rv At Ft Worth | 24 cfs | → |
| Wfk Trinityrv At White Settlement Rd | 8 cfs | → |
| W Fk Trinity Rv At Beach St | · | → |
| Clear Fk Trinity Rv At Ft Worth | 7 cfs | → |
| Walnut Ck At Reno | 1 cfs | → |


About Loughridge Lake Dam
Where does the data for Loughridge Lake Dam come from?
Structural and regulatory data come from the U.S. Army Corps of Engineers' National Inventory of Dams (NID). Weather forecast comes from NOAA / yr.no -- the same feed Snoflo's iOS app uses.
How often is the report updated?
NID structural data refreshes annually as the Corps publishes updated assessments. The weather forecast refreshes throughout the day.
What does the Not Available hazard rating mean?
The Corps of Engineers' hazard potential classification grades probable consequences if the dam fails: High = probable loss of human life; Significant = no probable loss of human life but possible economic loss / environmental damage; Low = no probable loss of human life, only minor economic / environmental losses. See the Dam Data Reference card below for the full definitions.
What's "% of normal"?
The current storage value compared to the historical average storage on this calendar day. 100% = right on average; values above 100% mean above-normal storage (wet year); values below mean below-normal (dry year or drought).
Can I get alerts when storage crosses a threshold?
Yes -- alerts are managed in the Snoflo iOS app. Favorite this dam, set a threshold, and you'll get a push the moment conditions cross.
Dam data reference
Condition Assessment
- Satisfactory
- No existing or potential dam safety deficiencies are recognized. Acceptable performance is expected under all loading conditions (static, hydrologic, seismic) in accordance with the minimum applicable state or federal regulatory criteria or tolerable risk guidelines.
- Fair
- No existing dam safety deficiencies are recognized for normal operating conditions. Rare or extreme hydrologic and/or seismic events may result in a dam safety deficiency. Risk may be in the range to take further action.
- Poor
- A dam safety deficiency is recognized for normal operating conditions which may realistically occur. Remedial action is necessary. POOR may also be used when uncertainties exist as to critical analysis parameters which identify a potential dam safety deficiency.
- Unsatisfactory
- A dam safety deficiency is recognized that requires immediate or emergency remedial action for problem resolution.
- Not Rated
- The dam has not been inspected, is not under state or federal jurisdiction, or has been inspected but, for whatever reason, has not been rated.
Hazard Potential Classification
- High
- Dams assigned the high hazard potential classification are those where failure or mis-operation will probably cause loss of human life.
- Significant
- Dams assigned the significant hazard potential classification are those dams where failure or mis-operation results in no probable loss of human life but can cause economic loss, environmental damage, disruption of lifeline facilities, or impact other concerns. Significant hazard potential classification dams are often located in predominantly rural or agricultural areas but could be in areas with population and significant infrastructure.
- Low
- Dams assigned the low hazard potential classification are those where failure or mis-operation results in no probable loss of human life and low economic and/or environmental losses. Losses are principally limited to the owner's property.
- Undetermined
- Dams for which a downstream hazard potential has not been designated or is not provided.