Upper Lake Mary dam

Upper Lake Mary
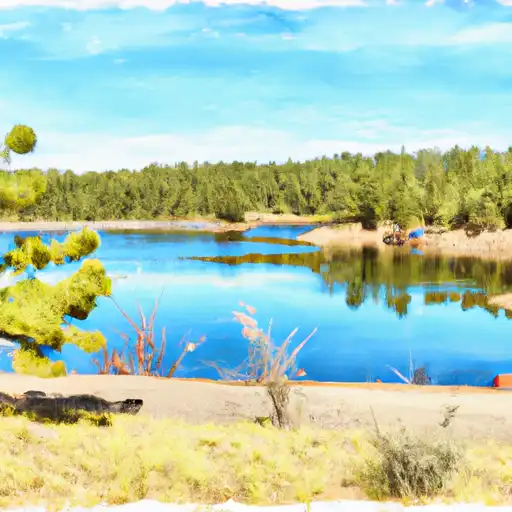
Upper Lake Mary, located in Coconino, Arizona, is a captivating destination for water resource and climate enthusiasts. This local government-owned reservoir, completed in 1941, serves primarily for recreation and water supply purposes. With a capacity of 21,041 acre-feet and a surface area of 1,058 acres, Upper Lake Mary is a significant water source in the region, drawing from a drainage area of 54.3 square miles.
Standing at a height of 38 feet with a structural height of 49 feet, the earth dam on Upper Lake Mary impounds water from Walnut Creek. The reservoir boasts a spillway width of 360 feet and a maximum discharge capacity of 11,000 cubic feet per second. Despite its significant hazard potential, the dam's condition assessment in 2015 deemed it satisfactory, ensuring the safety and stability of the structure for water storage and recreational activities.
With its scenic location near Walnut Canyon National Monument and I-40, Upper Lake Mary offers a serene and picturesque setting for outdoor enthusiasts. The reservoir's moderate risk assessment and regular inspection schedule, every three years, highlight its commitment to safety and environmental stewardship. Whether for boating, fishing, or simply enjoying the natural beauty of the area, Upper Lake Mary is a must-visit destination for those interested in water resources and climate conservation.
Plan around the weather
Same NOAA / yr.no feed Snoflo's iOS app uses. Watch the precipitation column on the meteogram -- rain on the basin upstream typically lifts inflow 24-72 hours later.
Next 5 days, hour by hour
Temperature line with weather symbols on top, snow + rain accumulation as columns, humidity as a dotted line.
5-day forecast table
Every 3 hours, broken out across temperature, snow, rain, humidity, and wind. Each cell is colour-coded relative to the column min/max.
| Time | Condition | Temp (°F) | Snow (in) | Rain (in) | Humidity (%) | Wind (mps) | Wind dir |
|---|---|---|---|---|---|---|---|
| Loading detailed forecast… | |||||||
15-day temperature & precipitation
Daily temperatures, snow, and rain projected over the next two weeks.
Nearby streamflow gauges
USGS streamgauges around Upper Lake Mary -- inflows here typically show up in storage 24-72 hours later.
| Streamgauge | Discharge | View |
|---|---|---|
| Oak Creek Near Sedona | 33 cfs | → |
| Dry Beaver Creek Near Rimrock | · | → |
| Wet Beaver Creek Near Rimrock | 8 cfs | → |
| Oak Creek Near Cornville | 22 cfs | → |
| Verde River Near Clarkdale | 58 cfs | → |
| West Clear Creek Near Camp Verde | 17 cfs | → |
Make a day of it
Boat launches, lakeside camping, fishing access, and other reservoirs near Upper Lake Mary.
Boat launches
See all →


Campgrounds
See all →


Fishing spots
See all →


River runs
See all →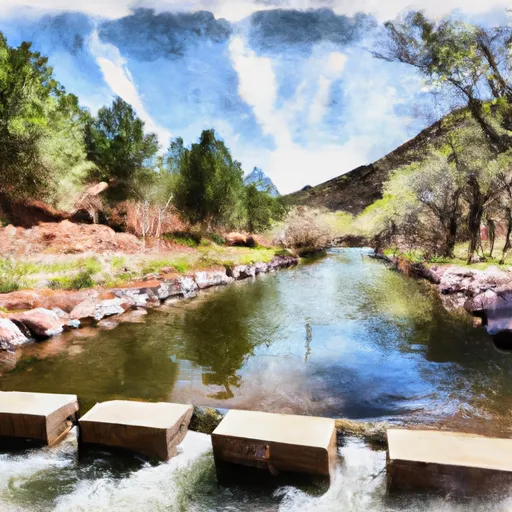


More reservoirs
See all →
About Upper Lake Mary
Where does the data for Upper Lake Mary come from?
Structural and regulatory data come from the U.S. Army Corps of Engineers' National Inventory of Dams (NID). Weather forecast comes from NOAA / yr.no -- the same feed Snoflo's iOS app uses.
How often is the report updated?
NID structural data refreshes annually as the Corps publishes updated assessments. The weather forecast refreshes throughout the day.
What does the Significant hazard rating mean?
The Corps of Engineers' hazard potential classification grades probable consequences if the dam fails: High = probable loss of human life; Significant = no probable loss of human life but possible economic loss / environmental damage; Low = no probable loss of human life, only minor economic / environmental losses. See the Dam Data Reference card below for the full definitions.
What's "% of normal"?
The current storage value compared to the historical average storage on this calendar day. 100% = right on average; values above 100% mean above-normal storage (wet year); values below mean below-normal (dry year or drought).
Can I get alerts when storage crosses a threshold?
Yes -- alerts are managed in the Snoflo iOS app. Favorite this dam, set a threshold, and you'll get a push the moment conditions cross.
Dam data reference
Condition Assessment
- Satisfactory
- No existing or potential dam safety deficiencies are recognized. Acceptable performance is expected under all loading conditions (static, hydrologic, seismic) in accordance with the minimum applicable state or federal regulatory criteria or tolerable risk guidelines.
- Fair
- No existing dam safety deficiencies are recognized for normal operating conditions. Rare or extreme hydrologic and/or seismic events may result in a dam safety deficiency. Risk may be in the range to take further action.
- Poor
- A dam safety deficiency is recognized for normal operating conditions which may realistically occur. Remedial action is necessary. POOR may also be used when uncertainties exist as to critical analysis parameters which identify a potential dam safety deficiency.
- Unsatisfactory
- A dam safety deficiency is recognized that requires immediate or emergency remedial action for problem resolution.
- Not Rated
- The dam has not been inspected, is not under state or federal jurisdiction, or has been inspected but, for whatever reason, has not been rated.
Hazard Potential Classification
- High
- Dams assigned the high hazard potential classification are those where failure or mis-operation will probably cause loss of human life.
- Significant
- Dams assigned the significant hazard potential classification are those dams where failure or mis-operation results in no probable loss of human life but can cause economic loss, environmental damage, disruption of lifeline facilities, or impact other concerns. Significant hazard potential classification dams are often located in predominantly rural or agricultural areas but could be in areas with population and significant infrastructure.
- Low
- Dams assigned the low hazard potential classification are those where failure or mis-operation results in no probable loss of human life and low economic and/or environmental losses. Losses are principally limited to the owner's property.
- Undetermined
- Dams for which a downstream hazard potential has not been designated or is not provided.