Portola dam

Portola
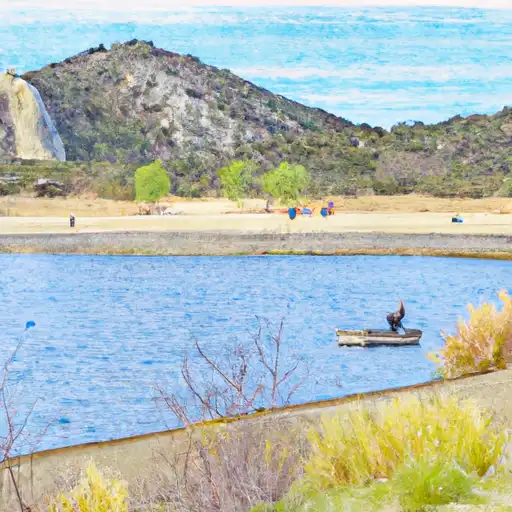
Portola Dam, located in Mission Viejo, California, is a vital part of the region's water supply infrastructure. Completed in 1980, this earth dam stands at a height of 53 feet and has a storage capacity of 586 acre-feet. Its primary purpose is to provide water for irrigation and drinking water needs in the area. The dam is regulated and inspected by the California Department of Water Resources for safety and compliance with state regulations.
The Portola Dam is situated on the Canada Gobernadora River and is managed by a public utility entity. With a high hazard potential, the dam is regularly assessed for its condition and emergency preparedness. The latest inspection in November 2020 found the dam to be in satisfactory condition, meeting safety guidelines. In case of any emergencies, the dam operators have an Emergency Action Plan in place, last revised in December 2020, to ensure swift and effective response.
Enthusiasts of water resources and climate in Orange County can appreciate the significance of the Portola Dam in ensuring a reliable water supply for the community. With its critical role in water storage and distribution, as well as its adherence to regulatory standards and safety measures, the Portola Dam stands as a testament to responsible water management in the region. Its presence on the Canada Gobernadora River contributes to the environmental sustainability and resilience of Mission Viejo and surrounding areas.
Plan around the weather
Same NOAA / yr.no feed Snoflo's iOS app uses. Watch the precipitation column on the meteogram -- rain on the basin upstream typically lifts inflow 24-72 hours later.
Next 5 days, hour by hour
Temperature line with weather symbols on top, snow + rain accumulation as columns, humidity as a dotted line.
5-day forecast table
Every 3 hours, broken out across temperature, snow, rain, humidity, and wind. Each cell is colour-coded relative to the column min/max.
| Time | Condition | Temp (°F) | Snow (in) | Rain (in) | Humidity (%) | Wind (mps) | Wind dir |
|---|---|---|---|---|---|---|---|
| Loading detailed forecast… | |||||||
15-day temperature & precipitation
Daily temperatures, snow, and rain projected over the next two weeks.
Nearby streamflow gauges
USGS streamgauges around Portola -- inflows here typically show up in storage 24-72 hours later.
| Streamgauge | Discharge | View |
|---|---|---|
| Agua Chinon Wash Nr Irvine Ca | · | → |
| Arroyo Trabuco A San Juan Capistrano Ca | 2 cfs | → |
| Temescal C A Corona Lk Nr Corona Ca | · | → |
| San Mateo C Nr San Clemente Ca | 166 cfs | → |
| Cristianitos C Ab San Mateo C Nr San Clemente Ca | · | → |
| Sand Cyn C A Irvine Ca | 0 cfs | → |


About Portola
Where does the data for Portola come from?
Structural and regulatory data come from the U.S. Army Corps of Engineers' National Inventory of Dams (NID). Weather forecast comes from NOAA / yr.no -- the same feed Snoflo's iOS app uses.
How often is the report updated?
NID structural data refreshes annually as the Corps publishes updated assessments. The weather forecast refreshes throughout the day.
What does the High hazard rating mean?
The Corps of Engineers' hazard potential classification grades probable consequences if the dam fails: High = probable loss of human life; Significant = no probable loss of human life but possible economic loss / environmental damage; Low = no probable loss of human life, only minor economic / environmental losses. See the Dam Data Reference card below for the full definitions.
What's "% of normal"?
The current storage value compared to the historical average storage on this calendar day. 100% = right on average; values above 100% mean above-normal storage (wet year); values below mean below-normal (dry year or drought).
Can I get alerts when storage crosses a threshold?
Yes -- alerts are managed in the Snoflo iOS app. Favorite this dam, set a threshold, and you'll get a push the moment conditions cross.
Dam data reference
Condition Assessment
- Satisfactory
- No existing or potential dam safety deficiencies are recognized. Acceptable performance is expected under all loading conditions (static, hydrologic, seismic) in accordance with the minimum applicable state or federal regulatory criteria or tolerable risk guidelines.
- Fair
- No existing dam safety deficiencies are recognized for normal operating conditions. Rare or extreme hydrologic and/or seismic events may result in a dam safety deficiency. Risk may be in the range to take further action.
- Poor
- A dam safety deficiency is recognized for normal operating conditions which may realistically occur. Remedial action is necessary. POOR may also be used when uncertainties exist as to critical analysis parameters which identify a potential dam safety deficiency.
- Unsatisfactory
- A dam safety deficiency is recognized that requires immediate or emergency remedial action for problem resolution.
- Not Rated
- The dam has not been inspected, is not under state or federal jurisdiction, or has been inspected but, for whatever reason, has not been rated.
Hazard Potential Classification
- High
- Dams assigned the high hazard potential classification are those where failure or mis-operation will probably cause loss of human life.
- Significant
- Dams assigned the significant hazard potential classification are those dams where failure or mis-operation results in no probable loss of human life but can cause economic loss, environmental damage, disruption of lifeline facilities, or impact other concerns. Significant hazard potential classification dams are often located in predominantly rural or agricultural areas but could be in areas with population and significant infrastructure.
- Low
- Dams assigned the low hazard potential classification are those where failure or mis-operation results in no probable loss of human life and low economic and/or environmental losses. Losses are principally limited to the owner's property.
- Undetermined
- Dams for which a downstream hazard potential has not been designated or is not provided.