Warm Springs Dam

Warm Springs Dam
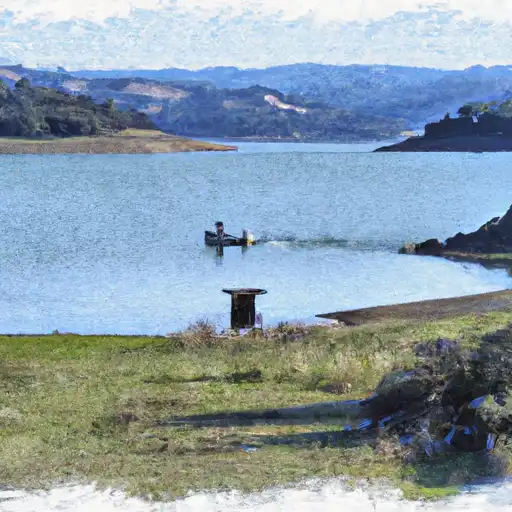
Warm Springs Dam, also known as Lake Sonoma, is a federal-owned structure located in Healdsburg, California, completed in 1983 for flood risk reduction. Standing at a height of 319 feet, with a storage capacity of 449,000 acre-feet, the dam poses a high hazard potential due to the risk of overtopping during major storm events or seismic activity. In the event of a breach, surrounding areas such as Healdsburg, Windsor, Sebastopol, Santa Rosa, and Guerneville could face significant impacts, highlighting the importance of effective risk management measures.
To mitigate potential risks, the US Army Corps of Engineers (USACE) has implemented various measures at Warm Springs Dam, including enhanced monitoring, surveillance, and an emergency action plan. Weather forecasts are used to manage water levels in the reservoir, while trained staff continuously monitor dam safety concerns during storm conditions. Additionally, the EAP facilitates clear communication and coordinated response actions in the event of a dam-related emergency, ensuring public safety through timely warnings and evacuation orders. Despite the identified risks, ongoing efforts by the USACE aim to minimize the impact of potential dam failures on downstream communities and infrastructure.
Plan around the weather
Same NOAA / yr.no feed Snoflo's iOS app uses. Watch the precipitation column on the meteogram -- rain on the basin upstream typically lifts inflow 24-72 hours later.
Next 5 days, hour by hour
Temperature line with weather symbols on top, snow + rain accumulation as columns, humidity as a dotted line.
5-day forecast table
Every 3 hours, broken out across temperature, snow, rain, humidity, and wind. Each cell is colour-coded relative to the column min/max.
| Time | Condition | Temp (°F) | Snow (in) | Rain (in) | Humidity (%) | Wind (mps) | Wind dir |
|---|---|---|---|---|---|---|---|
| Loading detailed forecast… | |||||||
15-day temperature & precipitation
Daily temperatures, snow, and rain projected over the next two weeks.
Nearby streamflow gauges
USGS streamgauges around Warm Springs Dam -- inflows here typically show up in storage 24-72 hours later.
| Streamgauge | Discharge | View |
|---|---|---|
| Dry C Nr Geyserville Ca | 200 cfs | → |
| Russian R A Geyserville Ca | 84 cfs | → |
| Dry C Blw Lambert Br Nr Geyserville Ca | 120 cfs | → |
| Big Sulphur C Nr Cloverdale Ca | 5 cfs | → |
| Russian R A Digger Bend Nr Healdsburg Ca | 94 cfs | → |
| Russian R A Jimtown Ca | 94 cfs | → |


About Warm Springs Dam
Where does the data for Warm Springs Dam come from?
Structural and regulatory data come from the U.S. Army Corps of Engineers' National Inventory of Dams (NID). Weather forecast comes from NOAA / yr.no -- the same feed Snoflo's iOS app uses.
How often is the report updated?
NID structural data refreshes annually as the Corps publishes updated assessments. The weather forecast refreshes throughout the day.
What does the High hazard rating mean?
The Corps of Engineers' hazard potential classification grades probable consequences if the dam fails: High = probable loss of human life; Significant = no probable loss of human life but possible economic loss / environmental damage; Low = no probable loss of human life, only minor economic / environmental losses. See the Dam Data Reference card below for the full definitions.
What's "% of normal"?
The current storage value compared to the historical average storage on this calendar day. 100% = right on average; values above 100% mean above-normal storage (wet year); values below mean below-normal (dry year or drought).
Can I get alerts when storage crosses a threshold?
Yes -- alerts are managed in the Snoflo iOS app. Favorite this dam, set a threshold, and you'll get a push the moment conditions cross.
Dam data reference
Condition Assessment
- Satisfactory
- No existing or potential dam safety deficiencies are recognized. Acceptable performance is expected under all loading conditions (static, hydrologic, seismic) in accordance with the minimum applicable state or federal regulatory criteria or tolerable risk guidelines.
- Fair
- No existing dam safety deficiencies are recognized for normal operating conditions. Rare or extreme hydrologic and/or seismic events may result in a dam safety deficiency. Risk may be in the range to take further action.
- Poor
- A dam safety deficiency is recognized for normal operating conditions which may realistically occur. Remedial action is necessary. POOR may also be used when uncertainties exist as to critical analysis parameters which identify a potential dam safety deficiency.
- Unsatisfactory
- A dam safety deficiency is recognized that requires immediate or emergency remedial action for problem resolution.
- Not Rated
- The dam has not been inspected, is not under state or federal jurisdiction, or has been inspected but, for whatever reason, has not been rated.
Hazard Potential Classification
- High
- Dams assigned the high hazard potential classification are those where failure or mis-operation will probably cause loss of human life.
- Significant
- Dams assigned the significant hazard potential classification are those dams where failure or mis-operation results in no probable loss of human life but can cause economic loss, environmental damage, disruption of lifeline facilities, or impact other concerns. Significant hazard potential classification dams are often located in predominantly rural or agricultural areas but could be in areas with population and significant infrastructure.
- Low
- Dams assigned the low hazard potential classification are those where failure or mis-operation results in no probable loss of human life and low economic and/or environmental losses. Losses are principally limited to the owner's property.
- Undetermined
- Dams for which a downstream hazard potential has not been designated or is not provided.