Jones Pond Dam Dam

Jones Pond Dam
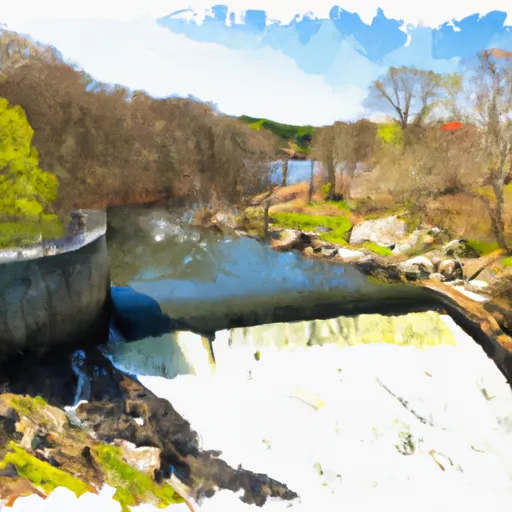
Jones Pond Dam, located in Morris, Connecticut, stands as a testament to both the beauty of nature and the ingenuity of human engineering. Built in 1938, this concrete structure serves primarily for recreation, offering a serene spot for water activities and leisure amidst the picturesque surroundings of the Bantam River Tributary. With a dam height of 6.5 feet and a storage capacity of 72 acre-feet, Jones Pond Dam provides a tranquil oasis for both locals and visitors to enjoy.
Despite its primary purpose for recreation, Jones Pond Dam also plays a crucial role in water resource management in the area. State regulated by the Department of Energy and Environmental Protection (DEEP), the dam's significant hazard potential underscores the importance of regular inspections and maintenance. While its condition assessment remains unrated, the dam's structural integrity and safety are paramount to safeguarding the surrounding community and environment.
As climate change continues to impact water resources and weather patterns, the management and upkeep of dams like Jones Pond Dam become increasingly vital. With its serene location and recreational opportunities, this concrete structure not only enhances the local landscape but also serves as a reminder of the delicate balance between human development and environmental stewardship in the face of a changing climate.
Plan around the weather
Same NOAA / yr.no feed Snoflo's iOS app uses. Watch the precipitation column on the meteogram -- rain on the basin upstream typically lifts inflow 24-72 hours later.
Next 5 days, hour by hour
Temperature line with weather symbols on top, snow + rain accumulation as columns, humidity as a dotted line.
5-day forecast table
Every 3 hours, broken out across temperature, snow, rain, humidity, and wind. Each cell is colour-coded relative to the column min/max.
| Time | Condition | Temp (°F) | Snow (in) | Rain (in) | Humidity (%) | Wind (mps) | Wind dir |
|---|---|---|---|---|---|---|---|
| Loading detailed forecast… | |||||||
15-day temperature & precipitation
Daily temperatures, snow, and rain projected over the next two weeks.
Nearby streamflow gauges
USGS streamgauges around Jones Pond Dam -- inflows here typically show up in storage 24-72 hours later.
| Streamgauge | Discharge | View |
|---|---|---|
| Shepaug River At Peters Dam At Woodville | 20 cfs | → |
| Nonewaug River At Minortown | 4 cfs | → |
| Weekeepeemee River At Hotchkissville | 7 cfs | → |
| Naugatuck River At Thomaston | 22 cfs | → |
| Housatonic River At Gaylordsville | 384 cfs | → |
| Pomperaug River At Southbury | 28 cfs | → |
Make a day of it
Boat launches, lakeside camping, fishing access, and other reservoirs near Jones Pond Dam.
Boat launches
See all →


Campgrounds
See all →


Fishing spots
See all →


River runs
See all →


About Jones Pond Dam
Where does the data for Jones Pond Dam come from?
Structural and regulatory data come from the U.S. Army Corps of Engineers' National Inventory of Dams (NID). Weather forecast comes from NOAA / yr.no -- the same feed Snoflo's iOS app uses.
How often is the report updated?
NID structural data refreshes annually as the Corps publishes updated assessments. The weather forecast refreshes throughout the day.
What does the Significant hazard rating mean?
The Corps of Engineers' hazard potential classification grades probable consequences if the dam fails: High = probable loss of human life; Significant = no probable loss of human life but possible economic loss / environmental damage; Low = no probable loss of human life, only minor economic / environmental losses. See the Dam Data Reference card below for the full definitions.
What's "% of normal"?
The current storage value compared to the historical average storage on this calendar day. 100% = right on average; values above 100% mean above-normal storage (wet year); values below mean below-normal (dry year or drought).
Can I get alerts when storage crosses a threshold?
Yes -- alerts are managed in the Snoflo iOS app. Favorite this dam, set a threshold, and you'll get a push the moment conditions cross.
Dam data reference
Condition Assessment
- Satisfactory
- No existing or potential dam safety deficiencies are recognized. Acceptable performance is expected under all loading conditions (static, hydrologic, seismic) in accordance with the minimum applicable state or federal regulatory criteria or tolerable risk guidelines.
- Fair
- No existing dam safety deficiencies are recognized for normal operating conditions. Rare or extreme hydrologic and/or seismic events may result in a dam safety deficiency. Risk may be in the range to take further action.
- Poor
- A dam safety deficiency is recognized for normal operating conditions which may realistically occur. Remedial action is necessary. POOR may also be used when uncertainties exist as to critical analysis parameters which identify a potential dam safety deficiency.
- Unsatisfactory
- A dam safety deficiency is recognized that requires immediate or emergency remedial action for problem resolution.
- Not Rated
- The dam has not been inspected, is not under state or federal jurisdiction, or has been inspected but, for whatever reason, has not been rated.
Hazard Potential Classification
- High
- Dams assigned the high hazard potential classification are those where failure or mis-operation will probably cause loss of human life.
- Significant
- Dams assigned the significant hazard potential classification are those dams where failure or mis-operation results in no probable loss of human life but can cause economic loss, environmental damage, disruption of lifeline facilities, or impact other concerns. Significant hazard potential classification dams are often located in predominantly rural or agricultural areas but could be in areas with population and significant infrastructure.
- Low
- Dams assigned the low hazard potential classification are those where failure or mis-operation results in no probable loss of human life and low economic and/or environmental losses. Losses are principally limited to the owner's property.
- Undetermined
- Dams for which a downstream hazard potential has not been designated or is not provided.