Farm Brook Flood Control Site #2a Dam Dam

Farm Brook Flood Control Site #2a Dam
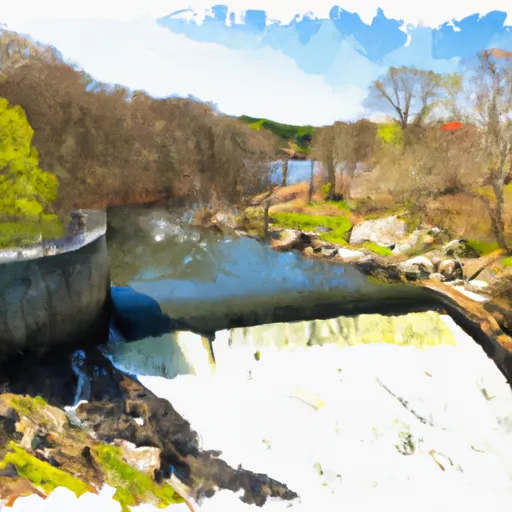
Farm Brook Flood Control Site #2a Dam, also known as Farm Brook Pond Site #2a, is a crucial structure located in Hamden, Connecticut, designed by the USDA NRCS. Completed in 1977, this earth dam stands at 29 feet high and stretches 440 feet in length, serving the primary purpose of flood risk reduction along the Farm Brook. With a storage capacity of 10 acre-feet and a spillway width of 15 feet, this dam plays a vital role in mitigating flood hazards in the area.
Managed by the state regulatory agency DEEP, Farm Brook Flood Control Site #2a Dam is considered to have a high hazard potential but is currently in satisfactory condition, as assessed in 2015. Despite its age, the dam meets inspection, permitting, and enforcement requirements, ensuring its effectiveness in flood risk reduction. The risk assessment for this structure is moderate, indicating a level 3 risk, and while no emergency action plan (EAP) details are provided, the dam's overall risk management measures are currently not specified.
Located in New Haven County, Farm Brook Flood Control Site #2a Dam stands as a significant component of flood control infrastructure in the region, serving as a testament to the ongoing efforts to manage water resources and mitigate the impacts of climate change. With its strategic design and regulatory oversight, this dam remains a critical asset in safeguarding the local community from potential flooding events along the Farm Brook.
Plan around the weather
Same NOAA / yr.no feed Snoflo's iOS app uses. Watch the precipitation column on the meteogram -- rain on the basin upstream typically lifts inflow 24-72 hours later.
Next 5 days, hour by hour
Temperature line with weather symbols on top, snow + rain accumulation as columns, humidity as a dotted line.
5-day forecast table
Every 3 hours, broken out across temperature, snow, rain, humidity, and wind. Each cell is colour-coded relative to the column min/max.
| Time | Condition | Temp (°F) | Snow (in) | Rain (in) | Humidity (%) | Wind (mps) | Wind dir |
|---|---|---|---|---|---|---|---|
| Loading detailed forecast… | |||||||
15-day temperature & precipitation
Daily temperatures, snow, and rain projected over the next two weeks.
Nearby streamflow gauges
USGS streamgauges around Farm Brook Flood Control Site #2a Dam -- inflows here typically show up in storage 24-72 hours later.
| Streamgauge | Discharge | View |
|---|---|---|
| Mill R Nr Hamden | 10 cfs | → |
| Quinnipiac River At Wallingford | 74 cfs | → |
| Naugatuck River At Beacon Falls | 113 cfs | → |
| Housatonic River At Stevenson | 455 cfs | → |
| Coginchaug River At Middlefield | 9 cfs | → |
| Quinnipiac River At Southington | 10 cfs | → |
Make a day of it
Boat launches, lakeside camping, fishing access, and other reservoirs near Farm Brook Flood Control Site #2a Dam.
Boat launches
See all →


Campgrounds
See all →


Fishing spots
See all →


River runs
See all →


About Farm Brook Flood Control Site #2a Dam
Where does the data for Farm Brook Flood Control Site #2a Dam come from?
Structural and regulatory data come from the U.S. Army Corps of Engineers' National Inventory of Dams (NID). Weather forecast comes from NOAA / yr.no -- the same feed Snoflo's iOS app uses.
How often is the report updated?
NID structural data refreshes annually as the Corps publishes updated assessments. The weather forecast refreshes throughout the day.
What does the High hazard rating mean?
The Corps of Engineers' hazard potential classification grades probable consequences if the dam fails: High = probable loss of human life; Significant = no probable loss of human life but possible economic loss / environmental damage; Low = no probable loss of human life, only minor economic / environmental losses. See the Dam Data Reference card below for the full definitions.
What's "% of normal"?
The current storage value compared to the historical average storage on this calendar day. 100% = right on average; values above 100% mean above-normal storage (wet year); values below mean below-normal (dry year or drought).
Can I get alerts when storage crosses a threshold?
Yes -- alerts are managed in the Snoflo iOS app. Favorite this dam, set a threshold, and you'll get a push the moment conditions cross.
Dam data reference
Condition Assessment
- Satisfactory
- No existing or potential dam safety deficiencies are recognized. Acceptable performance is expected under all loading conditions (static, hydrologic, seismic) in accordance with the minimum applicable state or federal regulatory criteria or tolerable risk guidelines.
- Fair
- No existing dam safety deficiencies are recognized for normal operating conditions. Rare or extreme hydrologic and/or seismic events may result in a dam safety deficiency. Risk may be in the range to take further action.
- Poor
- A dam safety deficiency is recognized for normal operating conditions which may realistically occur. Remedial action is necessary. POOR may also be used when uncertainties exist as to critical analysis parameters which identify a potential dam safety deficiency.
- Unsatisfactory
- A dam safety deficiency is recognized that requires immediate or emergency remedial action for problem resolution.
- Not Rated
- The dam has not been inspected, is not under state or federal jurisdiction, or has been inspected but, for whatever reason, has not been rated.
Hazard Potential Classification
- High
- Dams assigned the high hazard potential classification are those where failure or mis-operation will probably cause loss of human life.
- Significant
- Dams assigned the significant hazard potential classification are those dams where failure or mis-operation results in no probable loss of human life but can cause economic loss, environmental damage, disruption of lifeline facilities, or impact other concerns. Significant hazard potential classification dams are often located in predominantly rural or agricultural areas but could be in areas with population and significant infrastructure.
- Low
- Dams assigned the low hazard potential classification are those where failure or mis-operation results in no probable loss of human life and low economic and/or environmental losses. Losses are principally limited to the owner's property.
- Undetermined
- Dams for which a downstream hazard potential has not been designated or is not provided.