Sandy Creek Ws #14 Dam

Sandy Creek Ws #14
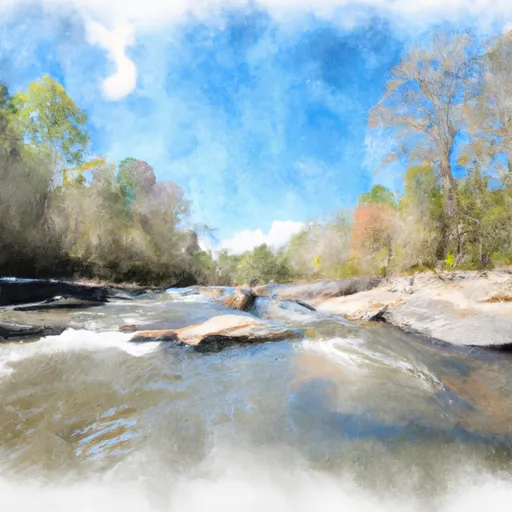
Sandy Creek WS #14 is a state-owned earth dam located in Jackson, Georgia, with a primary purpose of flood risk reduction. Built in 1963 by the Natural Resources Conservation Service, this buttress dam stands at a height of 29 feet and spans 480 feet in length. With a storage capacity of 342 acre-feet and a normal storage of 134 acre-feet, this dam serves a drainage area of 945 square miles.
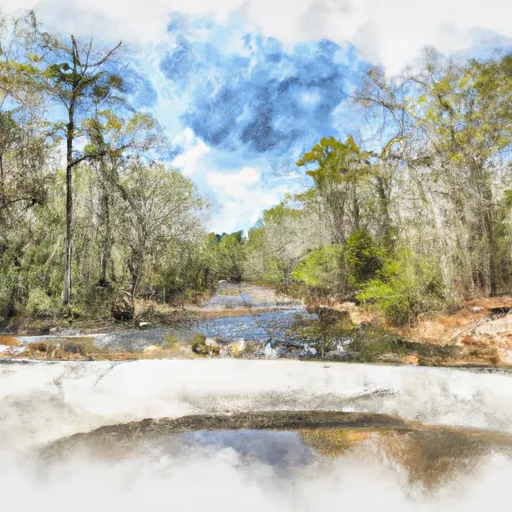
Despite being unlisted as state-regulated, Sandy Creek WS #14 has a low hazard potential and a moderate risk assessment. Inspected every 5 years, the dam's condition is currently rated as "Not Rated." Although lacking specific emergency action preparedness details, this dam is crucial for managing flood risk in the region. Positioned in a picturesque location with a surface area of 16 acres, this dam plays a vital role in protecting the surrounding community from potential inundation events.
For water resource and climate enthusiasts, Sandy Creek WS #14 offers an intriguing case study in dam engineering and flood risk management. With its historical construction dating back to the 1960s, this earth dam continues to play a significant role in safeguarding the local area from potential flooding. As an unregulated structure with a low hazard potential, the dam presents an opportunity for further exploration into risk assessment and emergency preparedness protocols.
Plan around the weather
Same NOAA / yr.no feed Snoflo's iOS app uses. Watch the precipitation column on the meteogram -- rain on the basin upstream typically lifts inflow 24-72 hours later.
Next 5 days, hour by hour
Temperature line with weather symbols on top, snow + rain accumulation as columns, humidity as a dotted line.
5-day forecast table
Every 3 hours, broken out across temperature, snow, rain, humidity, and wind. Each cell is colour-coded relative to the column min/max.
| Time | Condition | Temp (°F) | Snow (in) | Rain (in) | Humidity (%) | Wind (mps) | Wind dir |
|---|---|---|---|---|---|---|---|
| Loading detailed forecast… | |||||||
15-day temperature & precipitation
Daily temperatures, snow, and rain projected over the next two weeks.
Nearby streamflow gauges
USGS streamgauges around Sandy Creek Ws #14 -- inflows here typically show up in storage 24-72 hours later.
| Streamgauge | Discharge | View |
|---|---|---|
| North Oconee River At College St | 57 cfs | → |
| Middle Oconee River Near Arcade | 106 cfs | → |
| Middle Oconee River Near Athens | 109 cfs | → |
| Broad River Above Carlton | 273 cfs | → |
| South Fork Broad River At Carlton | 87 cfs | → |
| Apalachee River Near Bostwick | 70 cfs | → |
Make a day of it
Boat launches, lakeside camping, fishing access, and other reservoirs near Sandy Creek Ws #14.
Boat launches
See all →


Campgrounds
See all →


Fishing spots
See all →


River runs
See all →


More reservoirs
See all →
About Sandy Creek Ws #14
Where does the data for Sandy Creek Ws #14 come from?
Structural and regulatory data come from the U.S. Army Corps of Engineers' National Inventory of Dams (NID). Weather forecast comes from NOAA / yr.no -- the same feed Snoflo's iOS app uses.
How often is the report updated?
NID structural data refreshes annually as the Corps publishes updated assessments. The weather forecast refreshes throughout the day.
What does the Low hazard rating mean?
The Corps of Engineers' hazard potential classification grades probable consequences if the dam fails: High = probable loss of human life; Significant = no probable loss of human life but possible economic loss / environmental damage; Low = no probable loss of human life, only minor economic / environmental losses. See the Dam Data Reference card below for the full definitions.
What's "% of normal"?
The current storage value compared to the historical average storage on this calendar day. 100% = right on average; values above 100% mean above-normal storage (wet year); values below mean below-normal (dry year or drought).
Can I get alerts when storage crosses a threshold?
Yes -- alerts are managed in the Snoflo iOS app. Favorite this dam, set a threshold, and you'll get a push the moment conditions cross.
Dam data reference
Condition Assessment
- Satisfactory
- No existing or potential dam safety deficiencies are recognized. Acceptable performance is expected under all loading conditions (static, hydrologic, seismic) in accordance with the minimum applicable state or federal regulatory criteria or tolerable risk guidelines.
- Fair
- No existing dam safety deficiencies are recognized for normal operating conditions. Rare or extreme hydrologic and/or seismic events may result in a dam safety deficiency. Risk may be in the range to take further action.
- Poor
- A dam safety deficiency is recognized for normal operating conditions which may realistically occur. Remedial action is necessary. POOR may also be used when uncertainties exist as to critical analysis parameters which identify a potential dam safety deficiency.
- Unsatisfactory
- A dam safety deficiency is recognized that requires immediate or emergency remedial action for problem resolution.
- Not Rated
- The dam has not been inspected, is not under state or federal jurisdiction, or has been inspected but, for whatever reason, has not been rated.
Hazard Potential Classification
- High
- Dams assigned the high hazard potential classification are those where failure or mis-operation will probably cause loss of human life.
- Significant
- Dams assigned the significant hazard potential classification are those dams where failure or mis-operation results in no probable loss of human life but can cause economic loss, environmental damage, disruption of lifeline facilities, or impact other concerns. Significant hazard potential classification dams are often located in predominantly rural or agricultural areas but could be in areas with population and significant infrastructure.
- Low
- Dams assigned the low hazard potential classification are those where failure or mis-operation results in no probable loss of human life and low economic and/or environmental losses. Losses are principally limited to the owner's property.
- Undetermined
- Dams for which a downstream hazard potential has not been designated or is not provided.