Woronoco - South Dam Dam

Woronoco - South Dam
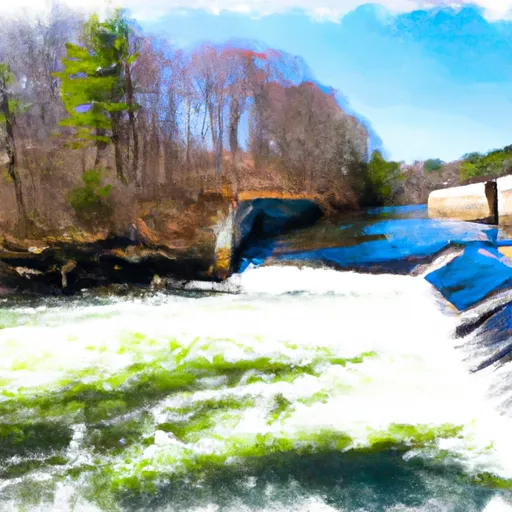
Woronoco - South Dam, also known as Woronoco Mills Dam, is a captivating structure located in Westfield, Massachusetts, along the picturesque Westfield River. Built in 1938, this concrete gravity dam stands at a height of 25 feet and stretches 351 feet in length, providing hydroelectric power and water supply to the area. With a storage capacity of 1830 acre-feet and a drainage area of 346 square miles, the dam plays a crucial role in managing water resources in the region.
Managed by a private owner and regulated by the Federal Energy Regulatory Commission, Woronoco - South Dam has a low hazard potential and a moderate risk assessment level. Despite its age, the dam has withstood the test of time, with regular inspections and maintenance ensuring its structural integrity. With a spillway width of 311 feet and a maximum discharge capacity of 10,500 cubic feet per second, the dam is well-equipped to handle potential flooding events and ensure the safety of nearby communities.
As a key feature in the local landscape, Woronoco - South Dam serves as a reminder of the intersection between water resource management and climate resilience. Its role in providing clean energy and water supply highlights the importance of sustainable infrastructure in adapting to a changing climate. With a commitment to safety and risk management, this historic dam continues to play a vital role in supporting the needs of the community while safeguarding the environment for future generations.
Plan around the weather
Same NOAA / yr.no feed Snoflo's iOS app uses. Watch the precipitation column on the meteogram -- rain on the basin upstream typically lifts inflow 24-72 hours later.
Next 5 days, hour by hour
Temperature line with weather symbols on top, snow + rain accumulation as columns, humidity as a dotted line.
5-day forecast table
Every 3 hours, broken out across temperature, snow, rain, humidity, and wind. Each cell is colour-coded relative to the column min/max.
| Time | Condition | Temp (°F) | Snow (in) | Rain (in) | Humidity (%) | Wind (mps) | Wind dir |
|---|---|---|---|---|---|---|---|
| Loading detailed forecast… | |||||||
15-day temperature & precipitation
Daily temperatures, snow, and rain projected over the next two weeks.
Nearby streamflow gauges
USGS streamgauges around Woronoco - South Dam -- inflows here typically show up in storage 24-72 hours later.
| Streamgauge | Discharge | View |
|---|---|---|
| West Branch Westfield River At Huntington | 20 cfs | → |
| Middle B Westfield River At Goss Heights | 8 cfs | → |
| Westfield River Near Westfield | 107 cfs | → |
| Westfield River At Knightville | 49 cfs | → |
| Hubbard River Nr. West Hartland | 2 cfs | → |
| Connecticut R At Interstate 391 Bridge At Holyoke | 4,010 cfs | → |
Make a day of it
Boat launches, lakeside camping, fishing access, and other reservoirs near Woronoco - South Dam .
Boat launches
See all →


Campgrounds
See all →


Fishing spots
See all →


River runs
See all →


About Woronoco - South Dam
Where does the data for Woronoco - South Dam come from?
Structural and regulatory data come from the U.S. Army Corps of Engineers' National Inventory of Dams (NID). Weather forecast comes from NOAA / yr.no -- the same feed Snoflo's iOS app uses.
How often is the report updated?
NID structural data refreshes annually as the Corps publishes updated assessments. The weather forecast refreshes throughout the day.
What does the Low hazard rating mean?
The Corps of Engineers' hazard potential classification grades probable consequences if the dam fails: High = probable loss of human life; Significant = no probable loss of human life but possible economic loss / environmental damage; Low = no probable loss of human life, only minor economic / environmental losses. See the Dam Data Reference card below for the full definitions.
What's "% of normal"?
The current storage value compared to the historical average storage on this calendar day. 100% = right on average; values above 100% mean above-normal storage (wet year); values below mean below-normal (dry year or drought).
Can I get alerts when storage crosses a threshold?
Yes -- alerts are managed in the Snoflo iOS app. Favorite this dam, set a threshold, and you'll get a push the moment conditions cross.
Dam data reference
Condition Assessment
- Satisfactory
- No existing or potential dam safety deficiencies are recognized. Acceptable performance is expected under all loading conditions (static, hydrologic, seismic) in accordance with the minimum applicable state or federal regulatory criteria or tolerable risk guidelines.
- Fair
- No existing dam safety deficiencies are recognized for normal operating conditions. Rare or extreme hydrologic and/or seismic events may result in a dam safety deficiency. Risk may be in the range to take further action.
- Poor
- A dam safety deficiency is recognized for normal operating conditions which may realistically occur. Remedial action is necessary. POOR may also be used when uncertainties exist as to critical analysis parameters which identify a potential dam safety deficiency.
- Unsatisfactory
- A dam safety deficiency is recognized that requires immediate or emergency remedial action for problem resolution.
- Not Rated
- The dam has not been inspected, is not under state or federal jurisdiction, or has been inspected but, for whatever reason, has not been rated.
Hazard Potential Classification
- High
- Dams assigned the high hazard potential classification are those where failure or mis-operation will probably cause loss of human life.
- Significant
- Dams assigned the significant hazard potential classification are those dams where failure or mis-operation results in no probable loss of human life but can cause economic loss, environmental damage, disruption of lifeline facilities, or impact other concerns. Significant hazard potential classification dams are often located in predominantly rural or agricultural areas but could be in areas with population and significant infrastructure.
- Low
- Dams assigned the low hazard potential classification are those where failure or mis-operation results in no probable loss of human life and low economic and/or environmental losses. Losses are principally limited to the owner's property.
- Undetermined
- Dams for which a downstream hazard potential has not been designated or is not provided.