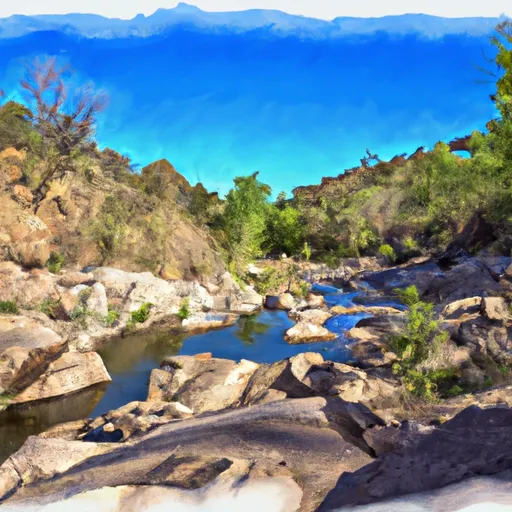
Lower Chalk Tank dam

Lower Chalk Tank
Lower Chalk Tank, located in Cochise, Arizona, is a privately owned earth dam completed in 2002 for fire protection, stock, and small fish pond purposes. With a dam height of 22.4 feet and a storage capacity of 54.3 acre-feet, this tank serves a vital role in water resource management in the area. The dam's low hazard potential and moderate risk assessment make it a reliable asset for the community.
Managed by the Arizona Department of Water Resources, Lower Chalk Tank is subject to state regulation, permitting, inspection, and enforcement to ensure its safety and functionality. Despite not being rated for condition assessment, the tank has a history of regular inspections, with the last one conducted in December 2010. The tank's location in a remote area with unknown river or stream connections highlights its importance in providing water resources for local wildlife and firefighting efforts.
Overall, Lower Chalk Tank stands as a valuable water resource infrastructure in Arizona, contributing to water storage, fire protection, and ecological support in the region. Its strategic location, design, and management by state authorities make it a crucial component in sustaining water availability and climate resilience in Cochise County.
Plan around the weather
Same NOAA / yr.no feed Snoflo's iOS app uses. Watch the precipitation column on the meteogram -- rain on the basin upstream typically lifts inflow 24-72 hours later.
Next 5 days, hour by hour
Temperature line with weather symbols on top, snow + rain accumulation as columns, humidity as a dotted line.
5-day forecast table
Every 3 hours, broken out across temperature, snow, rain, humidity, and wind. Each cell is colour-coded relative to the column min/max.
| Time | Condition | Temp (°F) | Snow (in) | Rain (in) | Humidity (%) | Wind (mps) | Wind dir |
|---|---|---|---|---|---|---|---|
| Loading detailed forecast… | |||||||
15-day temperature & precipitation
Daily temperatures, snow, and rain projected over the next two weeks.
Nearby streamflow gauges
USGS streamgauges around Lower Chalk Tank -- inflows here typically show up in storage 24-72 hours later.
| Streamgauge | Discharge | View |
|---|---|---|
| San Pedro River Near Benson | 0 cfs | → |
| San Pedro River Near Tombstone | 440 cfs | → |
| Babocomari River Near Tombstone | 2 cfs | → |
| San Pedro River At Charleston | 156 cfs | → |
| Leslie Creek Near Mcneal | · | → |
| Banning Creek Near Bisbee | · | → |
Make a day of it
Boat launches, lakeside camping, fishing access, and other reservoirs near Lower Chalk Tank.
Campgrounds
See all →


Fishing spots
See all →

River runs
See all →
About Lower Chalk Tank
Where does the data for Lower Chalk Tank come from?
Structural and regulatory data come from the U.S. Army Corps of Engineers' National Inventory of Dams (NID). Weather forecast comes from NOAA / yr.no -- the same feed Snoflo's iOS app uses.
How often is the report updated?
NID structural data refreshes annually as the Corps publishes updated assessments. The weather forecast refreshes throughout the day.
What does the Low hazard rating mean?
The Corps of Engineers' hazard potential classification grades probable consequences if the dam fails: High = probable loss of human life; Significant = no probable loss of human life but possible economic loss / environmental damage; Low = no probable loss of human life, only minor economic / environmental losses. See the Dam Data Reference card below for the full definitions.
What's "% of normal"?
The current storage value compared to the historical average storage on this calendar day. 100% = right on average; values above 100% mean above-normal storage (wet year); values below mean below-normal (dry year or drought).
Can I get alerts when storage crosses a threshold?
Yes -- alerts are managed in the Snoflo iOS app. Favorite this dam, set a threshold, and you'll get a push the moment conditions cross.
Dam data reference
Condition Assessment
- Satisfactory
- No existing or potential dam safety deficiencies are recognized. Acceptable performance is expected under all loading conditions (static, hydrologic, seismic) in accordance with the minimum applicable state or federal regulatory criteria or tolerable risk guidelines.
- Fair
- No existing dam safety deficiencies are recognized for normal operating conditions. Rare or extreme hydrologic and/or seismic events may result in a dam safety deficiency. Risk may be in the range to take further action.
- Poor
- A dam safety deficiency is recognized for normal operating conditions which may realistically occur. Remedial action is necessary. POOR may also be used when uncertainties exist as to critical analysis parameters which identify a potential dam safety deficiency.
- Unsatisfactory
- A dam safety deficiency is recognized that requires immediate or emergency remedial action for problem resolution.
- Not Rated
- The dam has not been inspected, is not under state or federal jurisdiction, or has been inspected but, for whatever reason, has not been rated.
Hazard Potential Classification
- High
- Dams assigned the high hazard potential classification are those where failure or mis-operation will probably cause loss of human life.
- Significant
- Dams assigned the significant hazard potential classification are those dams where failure or mis-operation results in no probable loss of human life but can cause economic loss, environmental damage, disruption of lifeline facilities, or impact other concerns. Significant hazard potential classification dams are often located in predominantly rural or agricultural areas but could be in areas with population and significant infrastructure.
- Low
- Dams assigned the low hazard potential classification are those where failure or mis-operation results in no probable loss of human life and low economic and/or environmental losses. Losses are principally limited to the owner's property.
- Undetermined
- Dams for which a downstream hazard potential has not been designated or is not provided.