U S Gypsum Tailings Pond Dam Dam

U S Gypsum Tailings Pond Dam
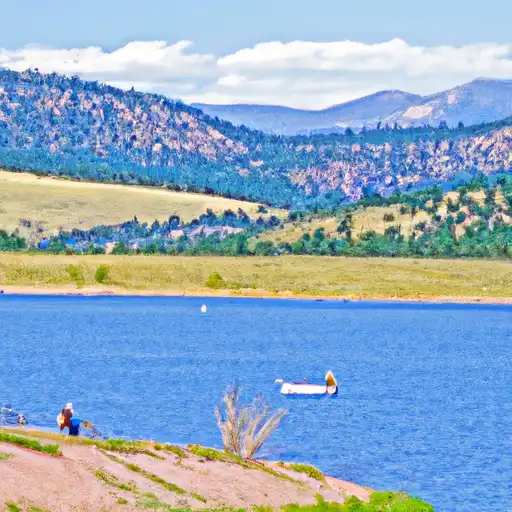
The U S Gypsum Tailings Pond Dam, located in Kings Creek Sc, North Carolina, stands as a vital structure in managing water resources in the region. Completed in 1972, this earth dam reaches a height of 50 feet and serves multiple purposes, including storage and drainage over a surface area of 7 acres. With a normal storage capacity of 120 acre-feet and a maximum storage of 140 acre-feet, this dam plays a crucial role in water management for the surrounding area.
Despite being privately owned, the U S Gypsum Tailings Pond Dam is subject to state inspection, ensuring its structural integrity and safety. With a low hazard potential and a fair condition assessment as of 2015, this dam continues to provide reliable water resource management for the community. The dam's proximity to Dixon Branch-Tr stream underscores its importance in maintaining water quality and quantity for the region.
As water resource and climate enthusiasts, understanding the significance of structures like the U S Gypsum Tailings Pond Dam is crucial in safeguarding our natural resources. With a steady inspection schedule and a history of responsible management, this dam stands as a testament to effective water resource infrastructure in North Carolina. It serves as a reminder of the importance of sustainable water management practices in the face of changing climate patterns and increasing water demands.
Plan around the weather
Same NOAA / yr.no feed Snoflo's iOS app uses. Watch the precipitation column on the meteogram -- rain on the basin upstream typically lifts inflow 24-72 hours later.
Next 5 days, hour by hour
Temperature line with weather symbols on top, snow + rain accumulation as columns, humidity as a dotted line.
5-day forecast table
Every 3 hours, broken out across temperature, snow, rain, humidity, and wind. Each cell is colour-coded relative to the column min/max.
| Time | Condition | Temp (°F) | Snow (in) | Rain (in) | Humidity (%) | Wind (mps) | Wind dir |
|---|---|---|---|---|---|---|---|
| Loading detailed forecast… | |||||||
15-day temperature & precipitation
Daily temperatures, snow, and rain projected over the next two weeks.
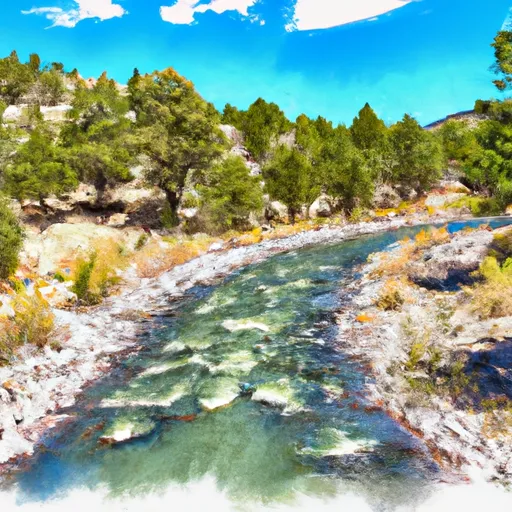
Nearby streamflow gauges
USGS streamgauges around U S Gypsum Tailings Pond Dam -- inflows here typically show up in storage 24-72 hours later.
| Streamgauge | Discharge | View |
|---|---|---|
| Long Creek Near Bessemer City | 2 cfs | → |
| Broad River Near Blacksburg | 532 cfs | → |
| Broad River Near Gaffney | 1,890 cfs | → |
| Broad River Below Cherokee Falls | 535 cfs | → |
| Indian Creek Near Laboratory | 8 cfs | → |
| South Fork Catawba River At Lowell | 290 cfs | → |


About U S Gypsum Tailings Pond Dam
Where does the data for U S Gypsum Tailings Pond Dam come from?
Structural and regulatory data come from the U.S. Army Corps of Engineers' National Inventory of Dams (NID). Weather forecast comes from NOAA / yr.no -- the same feed Snoflo's iOS app uses.
How often is the report updated?
NID structural data refreshes annually as the Corps publishes updated assessments. The weather forecast refreshes throughout the day.
What does the Low hazard rating mean?
The Corps of Engineers' hazard potential classification grades probable consequences if the dam fails: High = probable loss of human life; Significant = no probable loss of human life but possible economic loss / environmental damage; Low = no probable loss of human life, only minor economic / environmental losses. See the Dam Data Reference card below for the full definitions.
What's "% of normal"?
The current storage value compared to the historical average storage on this calendar day. 100% = right on average; values above 100% mean above-normal storage (wet year); values below mean below-normal (dry year or drought).
Can I get alerts when storage crosses a threshold?
Yes -- alerts are managed in the Snoflo iOS app. Favorite this dam, set a threshold, and you'll get a push the moment conditions cross.
Dam data reference
Condition Assessment
- Satisfactory
- No existing or potential dam safety deficiencies are recognized. Acceptable performance is expected under all loading conditions (static, hydrologic, seismic) in accordance with the minimum applicable state or federal regulatory criteria or tolerable risk guidelines.
- Fair
- No existing dam safety deficiencies are recognized for normal operating conditions. Rare or extreme hydrologic and/or seismic events may result in a dam safety deficiency. Risk may be in the range to take further action.
- Poor
- A dam safety deficiency is recognized for normal operating conditions which may realistically occur. Remedial action is necessary. POOR may also be used when uncertainties exist as to critical analysis parameters which identify a potential dam safety deficiency.
- Unsatisfactory
- A dam safety deficiency is recognized that requires immediate or emergency remedial action for problem resolution.
- Not Rated
- The dam has not been inspected, is not under state or federal jurisdiction, or has been inspected but, for whatever reason, has not been rated.
Hazard Potential Classification
- High
- Dams assigned the high hazard potential classification are those where failure or mis-operation will probably cause loss of human life.
- Significant
- Dams assigned the significant hazard potential classification are those dams where failure or mis-operation results in no probable loss of human life but can cause economic loss, environmental damage, disruption of lifeline facilities, or impact other concerns. Significant hazard potential classification dams are often located in predominantly rural or agricultural areas but could be in areas with population and significant infrastructure.
- Low
- Dams assigned the low hazard potential classification are those where failure or mis-operation results in no probable loss of human life and low economic and/or environmental losses. Losses are principally limited to the owner's property.
- Undetermined
- Dams for which a downstream hazard potential has not been designated or is not provided.