Fort Gibson Dam - Dike 8 Dam

Fort Gibson Dam - Dike 8
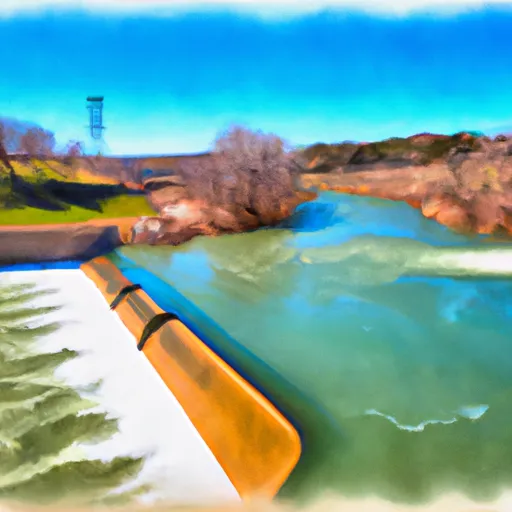
Fort Gibson Dam - Dike 8, also known as Fort Gibson Lake, is a gravity dam located on the Grand River in Wagoner, Oklahoma. Constructed in 1949 by the US Army Corps of Engineers, this dam stands at 110 feet tall and spans 2990 feet in length, with a storage capacity of 1,284,400 acre-feet. Its primary purpose is flood risk reduction, with a hazard potential rated as high and a risk assessment indicating very high risk.
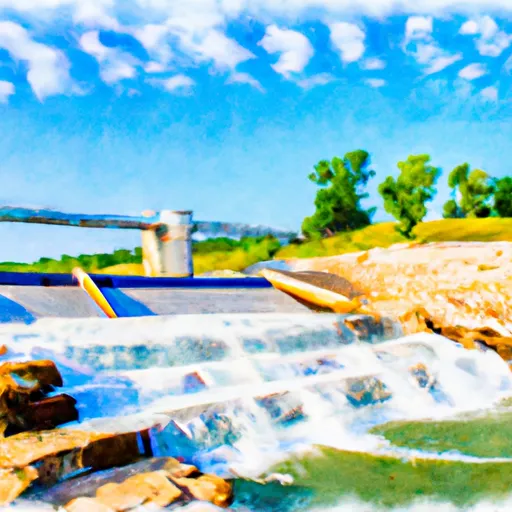
The US Army Corps of Engineers manages the dam’s flood risk by monitoring its condition, prioritizing necessary actions, and collaborating with local emergency managers and the public to raise awareness and preparedness in case of a dam-related emergency. The dam has a controlled spillway with a width of 1490 feet, and its risk management measures include continuous maintenance, regular updates to the emergency action plan, and coordination with local authorities for emergency response planning. Despite the dam’s efforts to mitigate flooding, the risk of overflow during severe weather events remains a concern, prompting ongoing monitoring and risk assessment activities by the USACE.
In conclusion, Fort Gibson Dam - Dike 8 plays a crucial role in managing flood risk along the Grand River, with the US Army Corps of Engineers implementing strategies to ensure the dam’s structural integrity and readiness for emergencies. As water resource and climate enthusiasts, it is important to recognize the complex challenges and responsibilities involved in dam operation and maintenance, especially in the face of changing weather patterns and increased flood risks.
Plan around the weather
Same NOAA / yr.no feed Snoflo's iOS app uses. Watch the precipitation column on the meteogram -- rain on the basin upstream typically lifts inflow 24-72 hours later.
Next 5 days, hour by hour
Temperature line with weather symbols on top, snow + rain accumulation as columns, humidity as a dotted line.
5-day forecast table
Every 3 hours, broken out across temperature, snow, rain, humidity, and wind. Each cell is colour-coded relative to the column min/max.
| Time | Condition | Temp (°F) | Snow (in) | Rain (in) | Humidity (%) | Wind (mps) | Wind dir |
|---|---|---|---|---|---|---|---|
| Loading detailed forecast… | |||||||
15-day temperature & precipitation
Daily temperatures, snow, and rain projected over the next two weeks.
Nearby streamflow gauges
USGS streamgauges around Fort Gibson Dam - Dike 8 -- inflows here typically show up in storage 24-72 hours later.
| Streamgauge | Discharge | View |
|---|---|---|
| Arkansas River Near Muskogee | 19,500 cfs | → |
| Arkansas River Near Haskell | 11,300 cfs | → |
| Illinois River Near Tahlequah | 481 cfs | → |
| Neosho River Near Chouteau | 752 cfs | → |
| Illinois River Near Gore | 293 cfs | → |
| Baron Fork At Eldon | 36 cfs | → |


About Fort Gibson Dam - Dike 8
Where does the data for Fort Gibson Dam - Dike 8 come from?
Structural and regulatory data come from the U.S. Army Corps of Engineers' National Inventory of Dams (NID). Weather forecast comes from NOAA / yr.no -- the same feed Snoflo's iOS app uses.
How often is the report updated?
NID structural data refreshes annually as the Corps publishes updated assessments. The weather forecast refreshes throughout the day.
What does the High hazard rating mean?
The Corps of Engineers' hazard potential classification grades probable consequences if the dam fails: High = probable loss of human life; Significant = no probable loss of human life but possible economic loss / environmental damage; Low = no probable loss of human life, only minor economic / environmental losses. See the Dam Data Reference card below for the full definitions.
What's "% of normal"?
The current storage value compared to the historical average storage on this calendar day. 100% = right on average; values above 100% mean above-normal storage (wet year); values below mean below-normal (dry year or drought).
Can I get alerts when storage crosses a threshold?
Yes -- alerts are managed in the Snoflo iOS app. Favorite this dam, set a threshold, and you'll get a push the moment conditions cross.
Dam data reference
Condition Assessment
- Satisfactory
- No existing or potential dam safety deficiencies are recognized. Acceptable performance is expected under all loading conditions (static, hydrologic, seismic) in accordance with the minimum applicable state or federal regulatory criteria or tolerable risk guidelines.
- Fair
- No existing dam safety deficiencies are recognized for normal operating conditions. Rare or extreme hydrologic and/or seismic events may result in a dam safety deficiency. Risk may be in the range to take further action.
- Poor
- A dam safety deficiency is recognized for normal operating conditions which may realistically occur. Remedial action is necessary. POOR may also be used when uncertainties exist as to critical analysis parameters which identify a potential dam safety deficiency.
- Unsatisfactory
- A dam safety deficiency is recognized that requires immediate or emergency remedial action for problem resolution.
- Not Rated
- The dam has not been inspected, is not under state or federal jurisdiction, or has been inspected but, for whatever reason, has not been rated.
Hazard Potential Classification
- High
- Dams assigned the high hazard potential classification are those where failure or mis-operation will probably cause loss of human life.
- Significant
- Dams assigned the significant hazard potential classification are those dams where failure or mis-operation results in no probable loss of human life but can cause economic loss, environmental damage, disruption of lifeline facilities, or impact other concerns. Significant hazard potential classification dams are often located in predominantly rural or agricultural areas but could be in areas with population and significant infrastructure.
- Low
- Dams assigned the low hazard potential classification are those where failure or mis-operation results in no probable loss of human life and low economic and/or environmental losses. Losses are principally limited to the owner's property.
- Undetermined
- Dams for which a downstream hazard potential has not been designated or is not provided.