Smith-Bybee Lakes Dam

Smith-Bybee Lakes
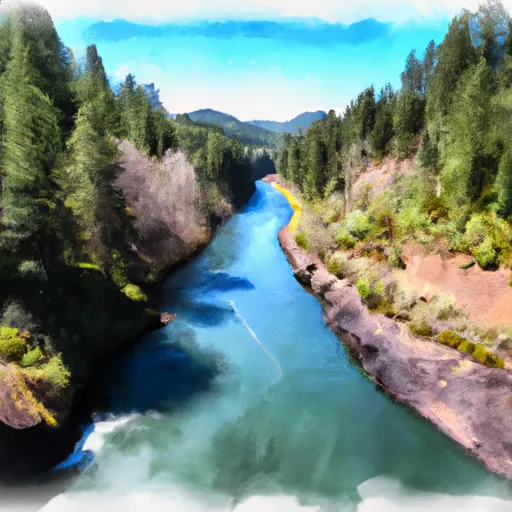
Smith-Bybee Lakes, located in Multnomah County, Oregon, is a captivating destination for water resource and climate enthusiasts. This fish and wildlife pond serves as a critical habitat for various species, offering a serene environment for both residents and visitors to enjoy. The dam at Smith-Bybee Lakes, completed in 1981, stands at a height of 14 feet and has a maximum storage capacity of 4100 acre-feet, providing essential water resources for the surrounding area.
With a surface area of 839 acres and a drainage area of 6.2 square miles, Smith-Bybee Lakes plays a crucial role in managing water flow and maintaining ecological balance in the region. The dam's low hazard potential and state-regulated status ensure the safety and sustainability of this vital water resource. Despite being not rated for condition assessment, Smith-Bybee Lakes continues to be a valuable asset for wildlife conservation and recreational activities in the area.
The picturesque setting of Smith-Bybee Lakes, nestled along the Columbia Slough, offers a peaceful retreat for nature lovers and outdoor enthusiasts. Managed by the local government, this concrete dam serves as a cornerstone for water management and conservation efforts in the region. Whether you're interested in birdwatching, fishing, or simply enjoying the beauty of nature, Smith-Bybee Lakes is a must-visit destination for those passionate about water resources and climate conservation.
Plan around the weather
Same NOAA / yr.no feed Snoflo's iOS app uses. Watch the precipitation column on the meteogram -- rain on the basin upstream typically lifts inflow 24-72 hours later.
Next 5 days, hour by hour
Temperature line with weather symbols on top, snow + rain accumulation as columns, humidity as a dotted line.
5-day forecast table
Every 3 hours, broken out across temperature, snow, rain, humidity, and wind. Each cell is colour-coded relative to the column min/max.
| Time | Condition | Temp (°F) | Snow (in) | Rain (in) | Humidity (%) | Wind (mps) | Wind dir |
|---|---|---|---|---|---|---|---|
| Loading detailed forecast… | |||||||
15-day temperature & precipitation
Daily temperatures, snow, and rain projected over the next two weeks.
Nearby streamflow gauges
USGS streamgauges around Smith-Bybee Lakes -- inflows here typically show up in storage 24-72 hours later.
| Streamgauge | Discharge | View |
|---|---|---|
| Columbia Slough At Portland | 826 cfs | → |
| Burnt Bridge Creek Near Mouth At Vancouver | 37 cfs | → |
| Willamette River At Portland | 8,710 cfs | → |
| Fanno Creek At 56th Ave | 0 cfs | → |
| Johnson Creek At Milwaukie | 18 cfs | → |
| Tryon Creek Blw Nettle Creek | 6 cfs | → |


About Smith-Bybee Lakes
Where does the data for Smith-Bybee Lakes come from?
Structural and regulatory data come from the U.S. Army Corps of Engineers' National Inventory of Dams (NID). Weather forecast comes from NOAA / yr.no -- the same feed Snoflo's iOS app uses.
How often is the report updated?
NID structural data refreshes annually as the Corps publishes updated assessments. The weather forecast refreshes throughout the day.
What does the Low hazard rating mean?
The Corps of Engineers' hazard potential classification grades probable consequences if the dam fails: High = probable loss of human life; Significant = no probable loss of human life but possible economic loss / environmental damage; Low = no probable loss of human life, only minor economic / environmental losses. See the Dam Data Reference card below for the full definitions.
What's "% of normal"?
The current storage value compared to the historical average storage on this calendar day. 100% = right on average; values above 100% mean above-normal storage (wet year); values below mean below-normal (dry year or drought).
Can I get alerts when storage crosses a threshold?
Yes -- alerts are managed in the Snoflo iOS app. Favorite this dam, set a threshold, and you'll get a push the moment conditions cross.
Dam data reference
Condition Assessment
- Satisfactory
- No existing or potential dam safety deficiencies are recognized. Acceptable performance is expected under all loading conditions (static, hydrologic, seismic) in accordance with the minimum applicable state or federal regulatory criteria or tolerable risk guidelines.
- Fair
- No existing dam safety deficiencies are recognized for normal operating conditions. Rare or extreme hydrologic and/or seismic events may result in a dam safety deficiency. Risk may be in the range to take further action.
- Poor
- A dam safety deficiency is recognized for normal operating conditions which may realistically occur. Remedial action is necessary. POOR may also be used when uncertainties exist as to critical analysis parameters which identify a potential dam safety deficiency.
- Unsatisfactory
- A dam safety deficiency is recognized that requires immediate or emergency remedial action for problem resolution.
- Not Rated
- The dam has not been inspected, is not under state or federal jurisdiction, or has been inspected but, for whatever reason, has not been rated.
Hazard Potential Classification
- High
- Dams assigned the high hazard potential classification are those where failure or mis-operation will probably cause loss of human life.
- Significant
- Dams assigned the significant hazard potential classification are those dams where failure or mis-operation results in no probable loss of human life but can cause economic loss, environmental damage, disruption of lifeline facilities, or impact other concerns. Significant hazard potential classification dams are often located in predominantly rural or agricultural areas but could be in areas with population and significant infrastructure.
- Low
- Dams assigned the low hazard potential classification are those where failure or mis-operation results in no probable loss of human life and low economic and/or environmental losses. Losses are principally limited to the owner's property.
- Undetermined
- Dams for which a downstream hazard potential has not been designated or is not provided.