Hendrickson Dam

Hendrickson
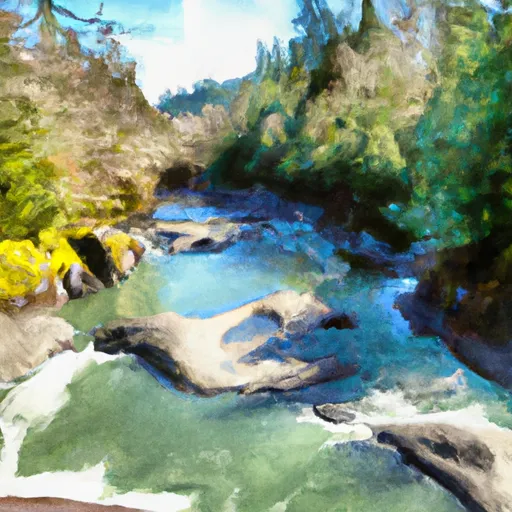
Hendrickson is a privately-owned earth dam located in Polk County, Oregon, along the Little Luckiamute River, with a primary purpose of recreation. Completed in 1991, this dam stands at a height of 25 feet and has a storage capacity of 24.5 acre-feet. With a surface area of 3.3 acres, this structure serves as a Fish and Wildlife Pond, providing a habitat for local wildlife and offering recreational opportunities for visitors.
Maintained by the Oregon Water Resources Department, Hendrickson is regulated and inspected regularly to ensure its safety and compliance with state regulations. Despite its low hazard potential, the dam has not been assessed for its condition, and emergency action plans are not currently in place. The outlet gates consist of a slide, or sluice gate, allowing for controlled release of water as needed. With no downstream settlement at risk, Hendrickson serves as a peaceful retreat for outdoor enthusiasts to enjoy nature and wildlife in a tranquil setting.
Located in a picturesque area with no downstream settlement to protect, Hendrickson serves as a vital resource for the local ecosystem and a popular spot for recreational activities. As water resource and climate enthusiasts explore the surrounding area, they can appreciate the beauty and functionality of this privately-owned dam, which enhances the quality of life for both wildlife and humans alike.
Plan around the weather
Same NOAA / yr.no feed Snoflo's iOS app uses. Watch the precipitation column on the meteogram -- rain on the basin upstream typically lifts inflow 24-72 hours later.
Next 5 days, hour by hour
Temperature line with weather symbols on top, snow + rain accumulation as columns, humidity as a dotted line.
5-day forecast table
Every 3 hours, broken out across temperature, snow, rain, humidity, and wind. Each cell is colour-coded relative to the column min/max.
| Time | Condition | Temp (°F) | Snow (in) | Rain (in) | Humidity (%) | Wind (mps) | Wind dir |
|---|---|---|---|---|---|---|---|
| Loading detailed forecast… | |||||||
15-day temperature & precipitation
Daily temperatures, snow, and rain projected over the next two weeks.
Nearby streamflow gauges
USGS streamgauges around Hendrickson -- inflows here typically show up in storage 24-72 hours later.
| Streamgauge | Discharge | View |
|---|---|---|
| Luckiamute River Near Suver | 55 cfs | → |
| Willamette River At Albany | 4,040 cfs | → |
| Willamette River At Corvallis | 4,050 cfs | → |
| Santiam River At Jefferson | 1,510 cfs | → |
| Willamette River At Salem | 5,840 cfs | → |
| Marys River Near Philomath | 22 cfs | → |


About Hendrickson
Where does the data for Hendrickson come from?
Structural and regulatory data come from the U.S. Army Corps of Engineers' National Inventory of Dams (NID). Weather forecast comes from NOAA / yr.no -- the same feed Snoflo's iOS app uses.
How often is the report updated?
NID structural data refreshes annually as the Corps publishes updated assessments. The weather forecast refreshes throughout the day.
What does the Low hazard rating mean?
The Corps of Engineers' hazard potential classification grades probable consequences if the dam fails: High = probable loss of human life; Significant = no probable loss of human life but possible economic loss / environmental damage; Low = no probable loss of human life, only minor economic / environmental losses. See the Dam Data Reference card below for the full definitions.
What's "% of normal"?
The current storage value compared to the historical average storage on this calendar day. 100% = right on average; values above 100% mean above-normal storage (wet year); values below mean below-normal (dry year or drought).
Can I get alerts when storage crosses a threshold?
Yes -- alerts are managed in the Snoflo iOS app. Favorite this dam, set a threshold, and you'll get a push the moment conditions cross.
Dam data reference
Condition Assessment
- Satisfactory
- No existing or potential dam safety deficiencies are recognized. Acceptable performance is expected under all loading conditions (static, hydrologic, seismic) in accordance with the minimum applicable state or federal regulatory criteria or tolerable risk guidelines.
- Fair
- No existing dam safety deficiencies are recognized for normal operating conditions. Rare or extreme hydrologic and/or seismic events may result in a dam safety deficiency. Risk may be in the range to take further action.
- Poor
- A dam safety deficiency is recognized for normal operating conditions which may realistically occur. Remedial action is necessary. POOR may also be used when uncertainties exist as to critical analysis parameters which identify a potential dam safety deficiency.
- Unsatisfactory
- A dam safety deficiency is recognized that requires immediate or emergency remedial action for problem resolution.
- Not Rated
- The dam has not been inspected, is not under state or federal jurisdiction, or has been inspected but, for whatever reason, has not been rated.
Hazard Potential Classification
- High
- Dams assigned the high hazard potential classification are those where failure or mis-operation will probably cause loss of human life.
- Significant
- Dams assigned the significant hazard potential classification are those dams where failure or mis-operation results in no probable loss of human life but can cause economic loss, environmental damage, disruption of lifeline facilities, or impact other concerns. Significant hazard potential classification dams are often located in predominantly rural or agricultural areas but could be in areas with population and significant infrastructure.
- Low
- Dams assigned the low hazard potential classification are those where failure or mis-operation results in no probable loss of human life and low economic and/or environmental losses. Losses are principally limited to the owner's property.
- Undetermined
- Dams for which a downstream hazard potential has not been designated or is not provided.