Ra Murphy Dam Dam

Ra Murphy Dam
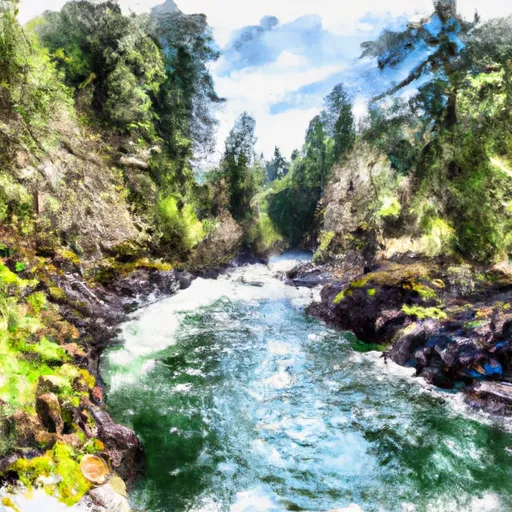
Ra Murphy Dam, also known as Shady Cove, is a private-owned structure located in Jackson County, Oregon. This dam is regulated by the Oregon Water Resources Department and has state jurisdiction, permitting, inspection, and enforcement in place. The dam stands at a height of 28 feet and has a storage capacity of 45 acre-feet, with low hazard potential and a condition assessment that is currently not rated.
Situated in a picturesque setting with coordinates 42.572113 latitude and -122.863761 longitude, Ra Murphy Dam plays a crucial role in water resource management in the area. Although details about its construction year, primary purpose, and specific dam type are not provided, the dam is regularly inspected every six years, with the last inspection conducted in December 2020. Despite not having an Emergency Action Plan (EAP) prepared or meeting certain guidelines, the dam's risk assessment, management measures, and inundation maps status remain unspecified, suggesting a need for further evaluation and planning.
With its low hazard potential and essential role in regulating water resources in the region, Ra Murphy Dam stands as a notable structure within the Portland District. Owned privately and serving the community of Shady Cove, this dam symbolizes the intricate balance between water resource management and environmental stewardship. As climate change continues to impact water availability and quality, the importance of maintaining and improving infrastructure like Ra Murphy Dam becomes increasingly evident for ensuring sustainable water management practices in the future.
Plan around the weather
Same NOAA / yr.no feed Snoflo's iOS app uses. Watch the precipitation column on the meteogram -- rain on the basin upstream typically lifts inflow 24-72 hours later.
Next 5 days, hour by hour
Temperature line with weather symbols on top, snow + rain accumulation as columns, humidity as a dotted line.
5-day forecast table
Every 3 hours, broken out across temperature, snow, rain, humidity, and wind. Each cell is colour-coded relative to the column min/max.
| Time | Condition | Temp (°F) | Snow (in) | Rain (in) | Humidity (%) | Wind (mps) | Wind dir |
|---|---|---|---|---|---|---|---|
| Loading detailed forecast… | |||||||
15-day temperature & precipitation
Daily temperatures, snow, and rain projected over the next two weeks.
Nearby streamflow gauges
USGS streamgauges around Ra Murphy Dam -- inflows here typically show up in storage 24-72 hours later.
| Streamgauge | Discharge | View |
|---|---|---|
| Rogue River At Dodge Bridge | 1,530 cfs | → |
| Rogue River Near Mcleod | 1,440 cfs | → |
| Elk Creek Near Trail | 1 cfs | → |
| Big Butte Creek Near Mcleod | 23 cfs | → |
| Rogue R At Cole M Rivers F Hatchery Nr Mcleod | 1,070 cfs | → |
| Rogue River At Raygold Near Central Point | 1,410 cfs | → |


About Ra Murphy Dam
Where does the data for Ra Murphy Dam come from?
Structural and regulatory data come from the U.S. Army Corps of Engineers' National Inventory of Dams (NID). Weather forecast comes from NOAA / yr.no -- the same feed Snoflo's iOS app uses.
How often is the report updated?
NID structural data refreshes annually as the Corps publishes updated assessments. The weather forecast refreshes throughout the day.
What does the Low hazard rating mean?
The Corps of Engineers' hazard potential classification grades probable consequences if the dam fails: High = probable loss of human life; Significant = no probable loss of human life but possible economic loss / environmental damage; Low = no probable loss of human life, only minor economic / environmental losses. See the Dam Data Reference card below for the full definitions.
What's "% of normal"?
The current storage value compared to the historical average storage on this calendar day. 100% = right on average; values above 100% mean above-normal storage (wet year); values below mean below-normal (dry year or drought).
Can I get alerts when storage crosses a threshold?
Yes -- alerts are managed in the Snoflo iOS app. Favorite this dam, set a threshold, and you'll get a push the moment conditions cross.
Dam data reference
Condition Assessment
- Satisfactory
- No existing or potential dam safety deficiencies are recognized. Acceptable performance is expected under all loading conditions (static, hydrologic, seismic) in accordance with the minimum applicable state or federal regulatory criteria or tolerable risk guidelines.
- Fair
- No existing dam safety deficiencies are recognized for normal operating conditions. Rare or extreme hydrologic and/or seismic events may result in a dam safety deficiency. Risk may be in the range to take further action.
- Poor
- A dam safety deficiency is recognized for normal operating conditions which may realistically occur. Remedial action is necessary. POOR may also be used when uncertainties exist as to critical analysis parameters which identify a potential dam safety deficiency.
- Unsatisfactory
- A dam safety deficiency is recognized that requires immediate or emergency remedial action for problem resolution.
- Not Rated
- The dam has not been inspected, is not under state or federal jurisdiction, or has been inspected but, for whatever reason, has not been rated.
Hazard Potential Classification
- High
- Dams assigned the high hazard potential classification are those where failure or mis-operation will probably cause loss of human life.
- Significant
- Dams assigned the significant hazard potential classification are those dams where failure or mis-operation results in no probable loss of human life but can cause economic loss, environmental damage, disruption of lifeline facilities, or impact other concerns. Significant hazard potential classification dams are often located in predominantly rural or agricultural areas but could be in areas with population and significant infrastructure.
- Low
- Dams assigned the low hazard potential classification are those where failure or mis-operation results in no probable loss of human life and low economic and/or environmental losses. Losses are principally limited to the owner's property.
- Undetermined
- Dams for which a downstream hazard potential has not been designated or is not provided.