Randolph Trucking Dam Dam

Randolph Trucking Dam
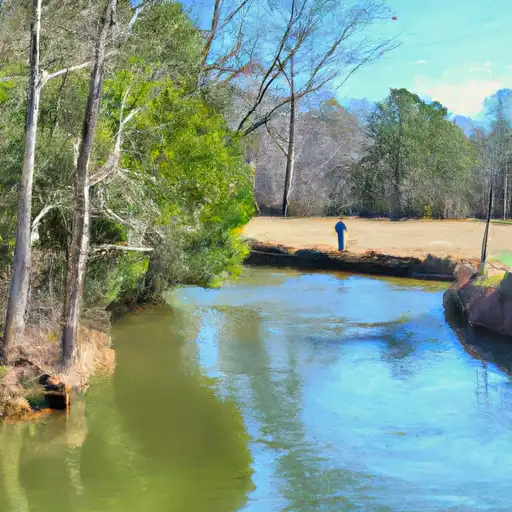
Randolph Trucking Dam, located in Cherokee, South Carolina, is a private earth dam primarily designed for recreational purposes. Standing at 26 feet high and spanning 275 feet in length, the dam boasts a storage capacity of 85 acre-feet, with a normal storage level of 70 acre-feet. The dam sits on the TR-JUMPING BRANCH river and is regulated by the SC DHEC, with state permitting, inspection, and enforcement in place to ensure its safety and compliance.
Despite its low hazard potential, the dam's condition assessment is marked as poor, with the last inspection conducted in August 2017. The dam's emergency action plan (EAP) status is unclear, raising concerns about preparedness in case of a potential breach. While the dam serves as a recreational spot for locals, its structural integrity and safety remain areas of focus for ongoing monitoring and maintenance efforts.
Randolph Trucking Dam presents a unique blend of recreational opportunities and regulatory oversight, making it a site of interest for water resource and climate enthusiasts. With its picturesque location and historical significance in the region, the dam serves as a reminder of the delicate balance between human intervention and nature's forces, highlighting the importance of sustainable infrastructure management for the future.
Plan around the weather
Same NOAA / yr.no feed Snoflo's iOS app uses. Watch the precipitation column on the meteogram -- rain on the basin upstream typically lifts inflow 24-72 hours later.
Next 5 days, hour by hour
Temperature line with weather symbols on top, snow + rain accumulation as columns, humidity as a dotted line.
5-day forecast table
Every 3 hours, broken out across temperature, snow, rain, humidity, and wind. Each cell is colour-coded relative to the column min/max.
| Time | Condition | Temp (°F) | Snow (in) | Rain (in) | Humidity (%) | Wind (mps) | Wind dir |
|---|---|---|---|---|---|---|---|
| Loading detailed forecast… | |||||||
15-day temperature & precipitation
Daily temperatures, snow, and rain projected over the next two weeks.
Nearby streamflow gauges
USGS streamgauges around Randolph Trucking Dam -- inflows here typically show up in storage 24-72 hours later.
| Streamgauge | Discharge | View |
|---|---|---|
| Broad River Near Blacksburg | 998 cfs | → |
| Broad River Near Gaffney | 1,890 cfs | → |
| Broad River Below Cherokee Falls | 643 cfs | → |
| Broad River Near Boiling Springs | 650 cfs | → |
| Long Creek Near Bessemer City | 3 cfs | → |
| Indian Creek Near Laboratory | 12 cfs | → |


About Randolph Trucking Dam
Where does the data for Randolph Trucking Dam come from?
Structural and regulatory data come from the U.S. Army Corps of Engineers' National Inventory of Dams (NID). Weather forecast comes from NOAA / yr.no -- the same feed Snoflo's iOS app uses.
How often is the report updated?
NID structural data refreshes annually as the Corps publishes updated assessments. The weather forecast refreshes throughout the day.
What does the Low hazard rating mean?
The Corps of Engineers' hazard potential classification grades probable consequences if the dam fails: High = probable loss of human life; Significant = no probable loss of human life but possible economic loss / environmental damage; Low = no probable loss of human life, only minor economic / environmental losses. See the Dam Data Reference card below for the full definitions.
What's "% of normal"?
The current storage value compared to the historical average storage on this calendar day. 100% = right on average; values above 100% mean above-normal storage (wet year); values below mean below-normal (dry year or drought).
Can I get alerts when storage crosses a threshold?
Yes -- alerts are managed in the Snoflo iOS app. Favorite this dam, set a threshold, and you'll get a push the moment conditions cross.
Dam data reference
Condition Assessment
- Satisfactory
- No existing or potential dam safety deficiencies are recognized. Acceptable performance is expected under all loading conditions (static, hydrologic, seismic) in accordance with the minimum applicable state or federal regulatory criteria or tolerable risk guidelines.
- Fair
- No existing dam safety deficiencies are recognized for normal operating conditions. Rare or extreme hydrologic and/or seismic events may result in a dam safety deficiency. Risk may be in the range to take further action.
- Poor
- A dam safety deficiency is recognized for normal operating conditions which may realistically occur. Remedial action is necessary. POOR may also be used when uncertainties exist as to critical analysis parameters which identify a potential dam safety deficiency.
- Unsatisfactory
- A dam safety deficiency is recognized that requires immediate or emergency remedial action for problem resolution.
- Not Rated
- The dam has not been inspected, is not under state or federal jurisdiction, or has been inspected but, for whatever reason, has not been rated.
Hazard Potential Classification
- High
- Dams assigned the high hazard potential classification are those where failure or mis-operation will probably cause loss of human life.
- Significant
- Dams assigned the significant hazard potential classification are those dams where failure or mis-operation results in no probable loss of human life but can cause economic loss, environmental damage, disruption of lifeline facilities, or impact other concerns. Significant hazard potential classification dams are often located in predominantly rural or agricultural areas but could be in areas with population and significant infrastructure.
- Low
- Dams assigned the low hazard potential classification are those where failure or mis-operation results in no probable loss of human life and low economic and/or environmental losses. Losses are principally limited to the owner's property.
- Undetermined
- Dams for which a downstream hazard potential has not been designated or is not provided.