Knapp Brook Site No. 1 Dam

Knapp Brook Site No. 1
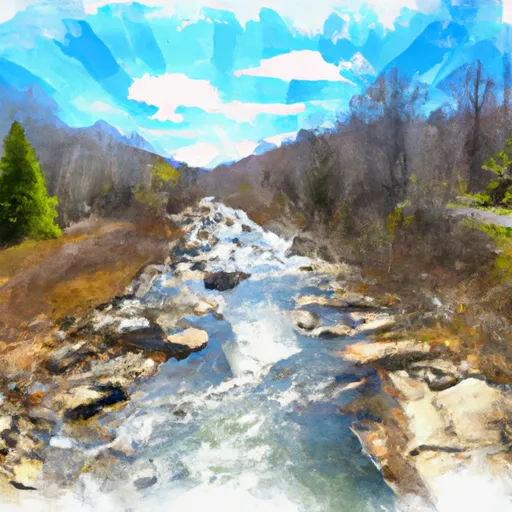
Knapp Brook Site No. 1, also known as Knapp Pond Site No. 1, is a state-owned recreational dam located in Cavendish, Vermont. The dam was completed in 1958 by the Department of Fish & Wildlife and is regulated by the Vermont Department of Environmental Conservation. With a height of 23 feet and a length of 400 feet, the dam holds a storage capacity of 292 acre-feet and covers a surface area of 25 acres.
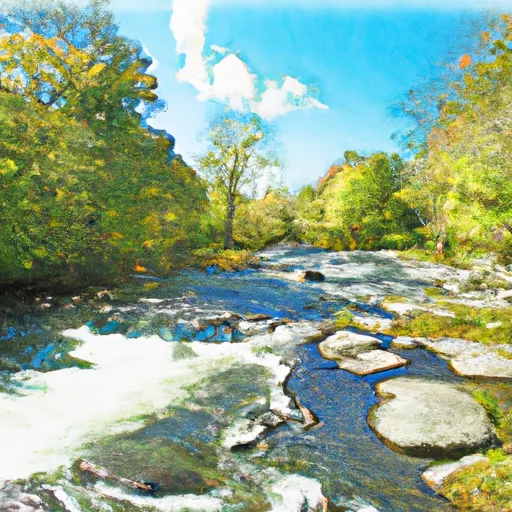
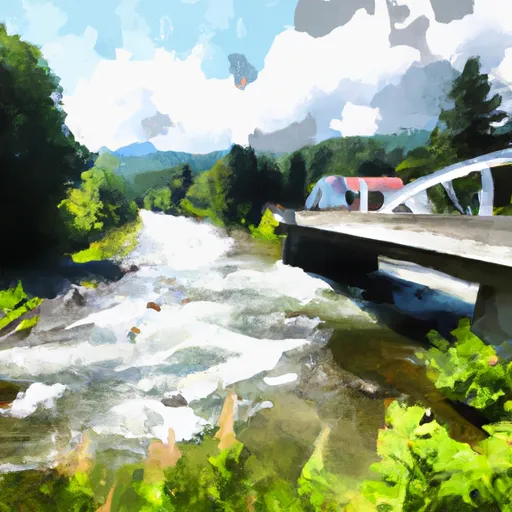
Despite its significant hazard potential and poor condition assessment, Knapp Brook Site No. 1 still serves as a popular recreational spot for visitors seeking outdoor activities by the water. The dam, constructed primarily of earth and stone materials on a soil foundation, is situated on Knapp Brook and plays a crucial role in managing water resources in the area. Even though the dam has not been inspected since July 2016, it remains under regular state jurisdiction, with permitting, inspection, and enforcement measures in place to ensure public safety and environmental protection.
As climate change continues to impact water resources and infrastructure across the country, sites like Knapp Brook Site No. 1 highlight the importance of properly maintaining and monitoring dams for both recreational and water management purposes. With its historical significance and current regulatory oversight, this dam represents a valuable asset in Vermont's efforts to balance water resource management with public recreation and safety.
Plan around the weather
Same NOAA / yr.no feed Snoflo's iOS app uses. Watch the precipitation column on the meteogram -- rain on the basin upstream typically lifts inflow 24-72 hours later.
Next 5 days, hour by hour
Temperature line with weather symbols on top, snow + rain accumulation as columns, humidity as a dotted line.
5-day forecast table
Every 3 hours, broken out across temperature, snow, rain, humidity, and wind. Each cell is colour-coded relative to the column min/max.
| Time | Condition | Temp (°F) | Snow (in) | Rain (in) | Humidity (%) | Wind (mps) | Wind dir |
|---|---|---|---|---|---|---|---|
| Loading detailed forecast… | |||||||
15-day temperature & precipitation
Daily temperatures, snow, and rain projected over the next two weeks.
Nearby streamflow gauges
USGS streamgauges around Knapp Brook Site No. 1 -- inflows here typically show up in storage 24-72 hours later.
| Streamgauge | Discharge | View |
|---|---|---|
| Black River At North Springfield | 56 cfs | → |
| Sugar River At West Claremont | 88 cfs | → |
| Ottauquechee River At North Hartland | 146 cfs | → |
| Ottauquechee River Near West Bridgewater | 12 cfs | → |
| Williams River Near Rockingham Vt | 28 cfs | → |
| Connecticut River At West Lebanon | 2,330 cfs | → |


About Knapp Brook Site No. 1
Where does the data for Knapp Brook Site No. 1 come from?
Structural and regulatory data come from the U.S. Army Corps of Engineers' National Inventory of Dams (NID). Weather forecast comes from NOAA / yr.no -- the same feed Snoflo's iOS app uses.
How often is the report updated?
NID structural data refreshes annually as the Corps publishes updated assessments. The weather forecast refreshes throughout the day.
What does the Significant hazard rating mean?
The Corps of Engineers' hazard potential classification grades probable consequences if the dam fails: High = probable loss of human life; Significant = no probable loss of human life but possible economic loss / environmental damage; Low = no probable loss of human life, only minor economic / environmental losses. See the Dam Data Reference card below for the full definitions.
What's "% of normal"?
The current storage value compared to the historical average storage on this calendar day. 100% = right on average; values above 100% mean above-normal storage (wet year); values below mean below-normal (dry year or drought).
Can I get alerts when storage crosses a threshold?
Yes -- alerts are managed in the Snoflo iOS app. Favorite this dam, set a threshold, and you'll get a push the moment conditions cross.
Dam data reference
Condition Assessment
- Satisfactory
- No existing or potential dam safety deficiencies are recognized. Acceptable performance is expected under all loading conditions (static, hydrologic, seismic) in accordance with the minimum applicable state or federal regulatory criteria or tolerable risk guidelines.
- Fair
- No existing dam safety deficiencies are recognized for normal operating conditions. Rare or extreme hydrologic and/or seismic events may result in a dam safety deficiency. Risk may be in the range to take further action.
- Poor
- A dam safety deficiency is recognized for normal operating conditions which may realistically occur. Remedial action is necessary. POOR may also be used when uncertainties exist as to critical analysis parameters which identify a potential dam safety deficiency.
- Unsatisfactory
- A dam safety deficiency is recognized that requires immediate or emergency remedial action for problem resolution.
- Not Rated
- The dam has not been inspected, is not under state or federal jurisdiction, or has been inspected but, for whatever reason, has not been rated.
Hazard Potential Classification
- High
- Dams assigned the high hazard potential classification are those where failure or mis-operation will probably cause loss of human life.
- Significant
- Dams assigned the significant hazard potential classification are those dams where failure or mis-operation results in no probable loss of human life but can cause economic loss, environmental damage, disruption of lifeline facilities, or impact other concerns. Significant hazard potential classification dams are often located in predominantly rural or agricultural areas but could be in areas with population and significant infrastructure.
- Low
- Dams assigned the low hazard potential classification are those where failure or mis-operation results in no probable loss of human life and low economic and/or environmental losses. Losses are principally limited to the owner's property.
- Undetermined
- Dams for which a downstream hazard potential has not been designated or is not provided.