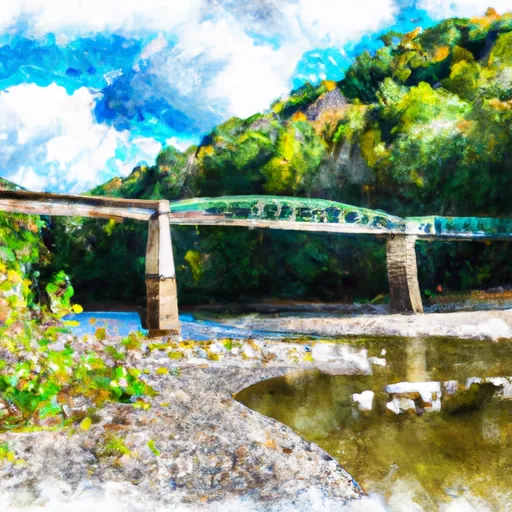
Sand Run Lake Dam

Sand Run Lake
Sand Run Lake, located in Tucker County, West Virginia, is a privately owned earth dam structure that was completed in 1978 for recreational purposes. The dam stands at a height of 18 feet and has a surface area of 19 acres, providing a picturesque setting for water and climate enthusiasts to enjoy. The lake is situated on the Tri-Blackwater River and is regulated by the West Virginia Department of Environmental Protection.
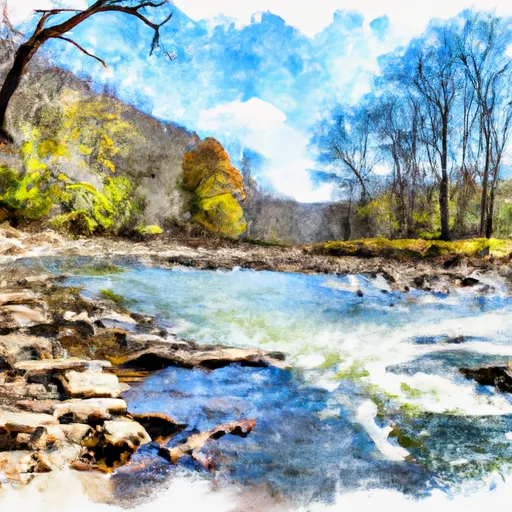
Despite its satisfactory condition assessment, Sand Run Lake is classified as having a significant hazard potential, prompting regular inspections every three years to ensure its safety and integrity. The dam is designed to hold back water for recreational use, with a normal storage capacity of 0 acre-feet. While no associated structures are present, the area is a popular spot for outdoor activities and wildlife observation, making it a valuable resource for the local community and visitors alike.
With its tranquil waters and scenic surroundings, Sand Run Lake offers a serene escape for those seeking to connect with nature and appreciate the beauty of West Virginia's water resources. As a privately owned recreation site, the lake serves as a reminder of the importance of responsible dam management and maintenance in preserving these natural landscapes for future generations to enjoy.
Plan around the weather
Same NOAA / yr.no feed Snoflo's iOS app uses. Watch the precipitation column on the meteogram -- rain on the basin upstream typically lifts inflow 24-72 hours later.
Next 5 days, hour by hour
Temperature line with weather symbols on top, snow + rain accumulation as columns, humidity as a dotted line.
5-day forecast table
Every 3 hours, broken out across temperature, snow, rain, humidity, and wind. Each cell is colour-coded relative to the column min/max.
| Time | Condition | Temp (°F) | Snow (in) | Rain (in) | Humidity (%) | Wind (mps) | Wind dir |
|---|---|---|---|---|---|---|---|
| Loading detailed forecast… | |||||||
15-day temperature & precipitation
Daily temperatures, snow, and rain projected over the next two weeks.
Nearby streamflow gauges
USGS streamgauges around Sand Run Lake -- inflows here typically show up in storage 24-72 hours later.
| Streamgauge | Discharge | View |
|---|---|---|
| Blackwater R Nr Davis | 132 cfs | → |
| Blackwater R At Davis | 32 cfs | → |
| N F South Br Potomac R At Cabins | 56 cfs | → |
| So. Branch Potomac River Nr Petersburg | 172 cfs | → |
| Dry Fork At Hendricks | 96 cfs | → |
| Mcmillan F Near Fort Pendleton | 2 cfs | → |


About Sand Run Lake
Where does the data for Sand Run Lake come from?
Structural and regulatory data come from the U.S. Army Corps of Engineers' National Inventory of Dams (NID). Weather forecast comes from NOAA / yr.no -- the same feed Snoflo's iOS app uses.
How often is the report updated?
NID structural data refreshes annually as the Corps publishes updated assessments. The weather forecast refreshes throughout the day.
What does the Significant hazard rating mean?
The Corps of Engineers' hazard potential classification grades probable consequences if the dam fails: High = probable loss of human life; Significant = no probable loss of human life but possible economic loss / environmental damage; Low = no probable loss of human life, only minor economic / environmental losses. See the Dam Data Reference card below for the full definitions.
What's "% of normal"?
The current storage value compared to the historical average storage on this calendar day. 100% = right on average; values above 100% mean above-normal storage (wet year); values below mean below-normal (dry year or drought).
Can I get alerts when storage crosses a threshold?
Yes -- alerts are managed in the Snoflo iOS app. Favorite this dam, set a threshold, and you'll get a push the moment conditions cross.
Dam data reference
Condition Assessment
- Satisfactory
- No existing or potential dam safety deficiencies are recognized. Acceptable performance is expected under all loading conditions (static, hydrologic, seismic) in accordance with the minimum applicable state or federal regulatory criteria or tolerable risk guidelines.
- Fair
- No existing dam safety deficiencies are recognized for normal operating conditions. Rare or extreme hydrologic and/or seismic events may result in a dam safety deficiency. Risk may be in the range to take further action.
- Poor
- A dam safety deficiency is recognized for normal operating conditions which may realistically occur. Remedial action is necessary. POOR may also be used when uncertainties exist as to critical analysis parameters which identify a potential dam safety deficiency.
- Unsatisfactory
- A dam safety deficiency is recognized that requires immediate or emergency remedial action for problem resolution.
- Not Rated
- The dam has not been inspected, is not under state or federal jurisdiction, or has been inspected but, for whatever reason, has not been rated.
Hazard Potential Classification
- High
- Dams assigned the high hazard potential classification are those where failure or mis-operation will probably cause loss of human life.
- Significant
- Dams assigned the significant hazard potential classification are those dams where failure or mis-operation results in no probable loss of human life but can cause economic loss, environmental damage, disruption of lifeline facilities, or impact other concerns. Significant hazard potential classification dams are often located in predominantly rural or agricultural areas but could be in areas with population and significant infrastructure.
- Low
- Dams assigned the low hazard potential classification are those where failure or mis-operation results in no probable loss of human life and low economic and/or environmental losses. Losses are principally limited to the owner's property.
- Undetermined
- Dams for which a downstream hazard potential has not been designated or is not provided.