Blue River Below Green Mountain Reservoir Flow Report
As of October 24, 2026, Blue River Below Green Mountain Reservoir is flowing at 163 cfs with a gage height of 3.31 ft. Source: USGS gauge #09057500, refreshed throughout the day.
Blue River Below Green Mountain Reservoir at a glance
Live reading, 10-day trend, and the key gauge stats — how Blue River Below Green Mountain Reservoir is running right now.
Blue River Below Green Mountain Reservoir is flowing at 163 cfs, with the water sitting 3.31 ft at the gage.
This is USGS gauge #09057500 in Colorado. Over the past 10 days the average has been 172 cfs, peaking at 188 cfs.
For real-time updates and historical context, see the realtime view or the historical comparison. Browse other gauges in the Colorado flow report, or open Blue River Below Green Mountain Reservoir on the interactive map.
Streamgage details
Historical Data
Streamflow Forecast
Over the next 5 days, Blue River Below Green Mountain Reservoir is expected to recede from today's 163 cfs, toward roughly 131 cfs by 2026-10-28 (likely range 69-249 cfs) -- running well below the seasonal normal.
Powered by PULSE — Snoflo’s forecast engine, trained on this gauge’s full record of storms, snowmelt, and dry spells.
Forecast vs seasonal normal
Engineering Data
Flow-duration statistics and observed peak-flow context computed from this gauge’s complete daily record (USGS #09057500).
Flow-duration & observed peak context
Estimate flows at an ungauged site
Drainage-area ratio transfer from this gauge . Most reliable for hydrologically similar sites in the same watershed with area ratios between roughly 0.5 and 1.5.
Percentiles are flow-duration values computed from this gauge’s observed daily record as archived by Snoflo. Return periods are Weibull plotting-position estimates from observed annual maxima, provided as general reference context only. Always verify against official USGS NWIS records. Part of Snoflo for Engineering.
How does this compare to past years?
Year-over-year overlay, annual peak discharge, the full distribution of daily flows on record, and the gauge's rating curve.
Weather Forecast
Next 5 days, hour by hour
Temperature line with weather symbols on top, snow + rain accumulation as columns, humidity as a dotted line.
5-day forecast table
Every 3 hours, broken out across temperature, snow, rain, humidity, and wind.
| Time | Condition | Temp (°F) | Snow (in) | Rain (in) | Humidity (%) | Wind (mps) | Wind dir |
|---|---|---|---|---|---|---|---|
| Loading detailed forecast… | |||||||
15-day forecast
Daily temperatures, snow, and rain projected over the next two weeks.
Blue River Below Green Mountain Reservoir
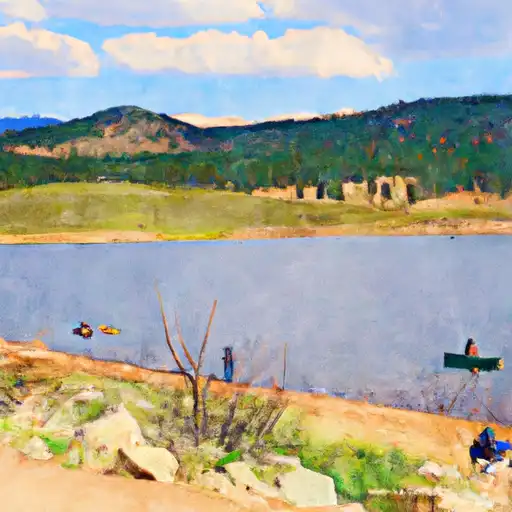
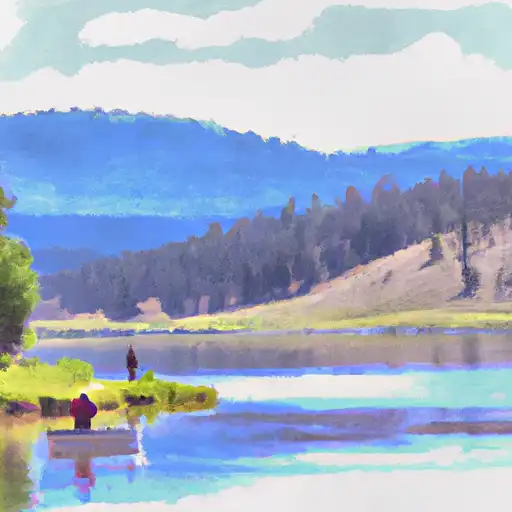
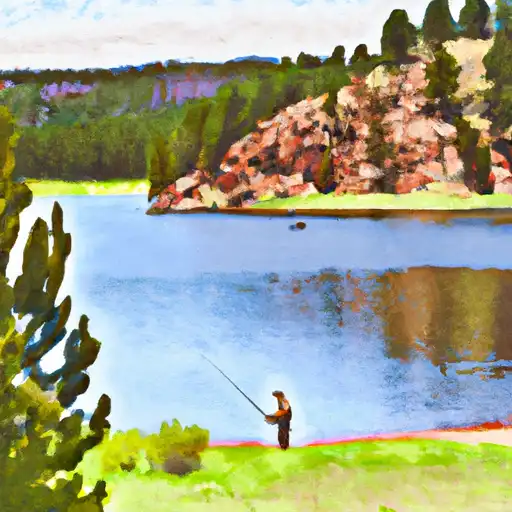
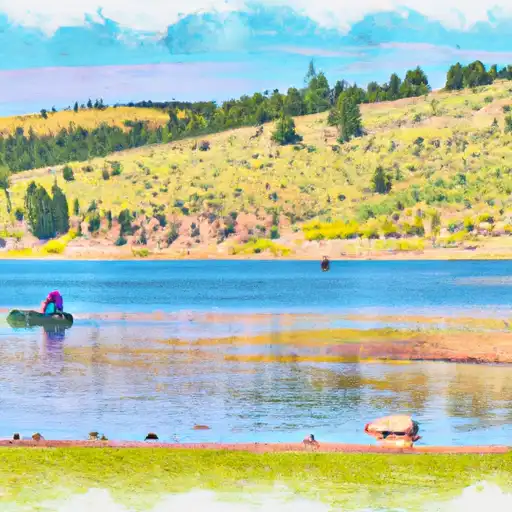
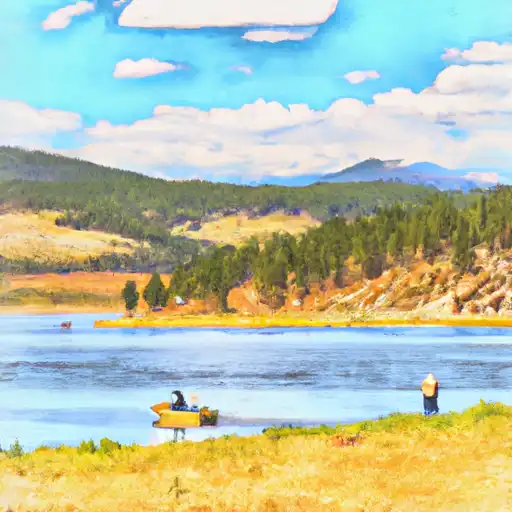
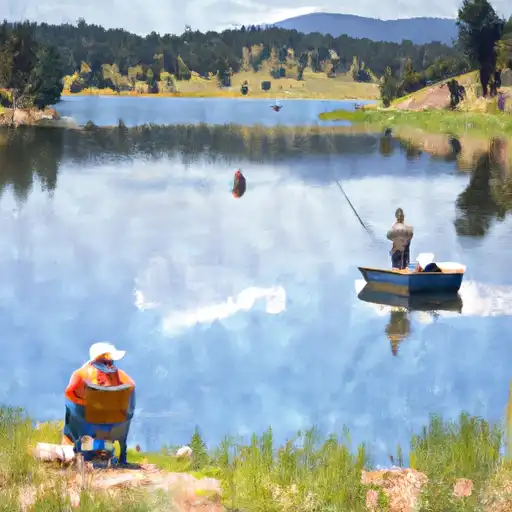
The primary source of flow is from the Green Mountain Reservoir, but there are also several tributaries that contribute to the overall water supply. The river experiences seasonal trends, with peak flows occurring in the late spring and early summer due to snowmelt. There are several dams along the river, including the Dillon Dam, which has been the subject of controversy due to concerns about potential failure. Despite this, the Blue River remains a popular destination for recreational activities such as fishing and rafting.
Nearby streamflow levels
Cross-check Blue River Below Green Mountain Reservoir's discharge against nearby gauges to spot whether the change here is local or regional.
| Gauge | Streamflow |
|---|---|
| Blue River Below Green Mountain Reservoir | 163 cfs |
| Williams Fork Near Parshall | 18 cfs |
| Colorado River Near Kremmling | 405 cfs |
| Williams Fork Below Williams Fork Reservoir | 109 cfs |
| Piney River Below Piney Lake | 3 cfs |
| Piney River Near State Bridge | 10 cfs |
Nearby snowpack data
Snowpack at SNOTEL stations near Blue River Below Green Mountain Reservoir. Spring snowmelt is the dominant driver of streamflow in mountain basins -- a deep snowpack upstream means more runoff later in the season.
| SNOTEL station | Snowpack |
|---|---|
| Silverthorne 21 Nw | 0 in |
| Elliot Ridge | 0 in |
| Elliot Ridge Snotel | 0 in |
| Williams Fork Dam | 0 in |
| Summit Ranch | 0 in |
| Nohrsc Summit Ranch | 0 in |


.webp)


River levels & flood safety
- Read the level before you go
- A river that's runnable at one flow can be deadly at another. Check current discharge and gage height — like the values shown above — against the flood-stage thresholds, and remember levels can spike fast after rain or a dam release.
- Respect cold water
- Snowmelt rivers run cold even in summer. Sudden immersion triggers cold-water shock and saps strength within minutes. Wear a PFD, dress for the water temperature (not the air), and never wade or paddle alone.
- Watch for swiftwater hazards
- Strainers (downed trees), undercut rocks, and low-head dams are the deadliest features on moving water. High, fast, muddy water hides them. If in doubt, scout from shore and portage.
- Mind flash floods & releases
- Narrow canyons can flood from a storm miles upstream, and dam-controlled reaches can rise without warning. Know the forecast, the release schedule, and your exit before you launch.
Track Blue River Below Green Mountain Reservoir in the Snoflo app
Save this gauge as a favorite, set push alerts when streamflow crosses a threshold (e.g. "alert me when Blue River Below Green Mountain Reservoir crosses 5,000 cfs"), and Snoflo's iOS app will push the moment USGS reports the crossing.
About Blue River Below Green Mountain Reservoir
What is the Blue River Below Green Mountain Reservoir flow rate right now?
As of October 24, 2026, Blue River Below Green Mountain Reservoir is flowing at 163 cfs. The live value, gage height, and 24-hour trend are shown at the top of this page.
Is the Blue River Below Green Mountain Reservoir running high or low right now?
Check the percent of median figure on this page: above 100% means Blue River Below Green Mountain Reservoir is running higher than normal for the date, below 100% means lower. The 24-hour trend shows whether it's rising or falling.
Where does the streamflow data for Blue River Below Green Mountain Reservoir come from?
Discharge, gage height, and water temperature come directly from the USGS streamflow gauge 09057500. Snoflo refreshes the time series throughout the day. Forecasts come from the NOAA / yr.no feed Snoflo's iOS app uses.
How often is the report updated?
USGS gauges report continuously (typically every 15 minutes). Snoflo pulls fresh values throughout the day — look for the "as of" timestamp on the streamflow hero card.
What's the difference between discharge and gage height?
Discharge (cubic feet per second, or cfs) is the volume of water flowing past the gauge each second. Gage height is how high the water sits at the gauge (feet). They're related by a rating curve specific to each gauge — higher water means more flow, but the exact ratio depends on channel shape.
How is "percent of median" calculated?
Today's discharge is compared to the historical median discharge on this calendar day across the gauge's full record. 100% = right on median; 200% = a very high year; 30% = a drought-level low.
What are flood stages, and is this river safe right now?
Flood stages are NWS-defined gage-height thresholds — Action, Minor, Moderate, Major — marking when nearby roads or floodplains start to be affected. "Safe" depends on your activity and skill: a level that's a fun paddle for an expert can be lethal for a wader. Always check the current level against the thresholds above and the safety links, and when in doubt, stay off the water.
Can I get alerts when Blue River Below Green Mountain Reservoir rises?
Yes — flow alerts are managed in the Snoflo iOS app. Favorite this gauge, set a streamflow threshold (e.g. "alert me when discharge crosses 5,000 cfs"), and you'll get a push the moment USGS reports the crossing.
Create a free account, or sign in.
Get the free Blue River Below Green Mountain Reservoir report — flow alerts, favorites, and history & forecasts, plus the free iPhone app.