Robbs Peak dam

Robbs Peak
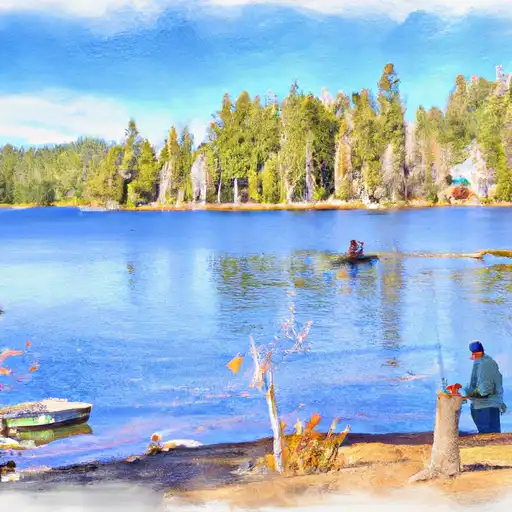
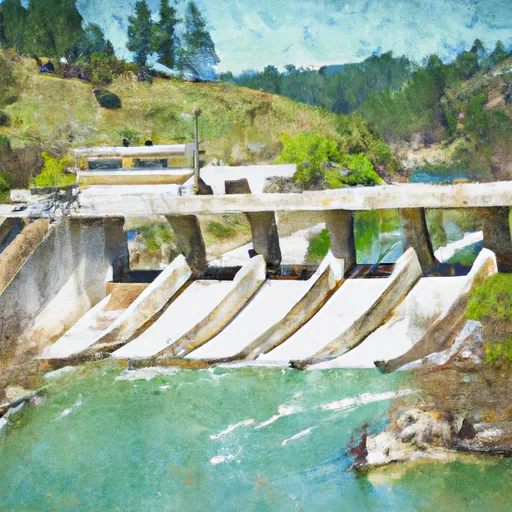
Robbs Peak, located in El Dorado County, California, is a concrete gravity dam completed in 1963 for hydroelectric purposes. Managed by a public utility company and regulated by the state and Federal Energy Regulatory Commission, this dam stands at a height of 50 feet and has a storage capacity of 150 acre-feet. The dam controls the flow of the South Fork Rubicon River and has a low hazard potential, with a very high risk assessment rating of 1.
With its controlled spillway and a maximum discharge capacity of 10,500 cubic feet per second, Robbs Peak plays a crucial role in water resource management for the surrounding area. The dam's location in Coloma, just 40 miles from the city of Sacramento, makes it a key component in the region's water infrastructure. Despite its age, Robbs Peak remains a reliable structure, with regular state inspections and enforcement ensuring its safety and functionality for the community.
Water resource and climate enthusiasts are drawn to Robbs Peak for its historical significance, innovative design by Bechtel, and impact on the local ecosystem. The dam's presence not only provides clean hydroelectric power but also contributes to flood control and water supply management. As a symbol of sustainable water resource management, Robbs Peak serves as a model for balancing human needs with environmental conservation in a changing climate.
Plan around the weather
Same NOAA / yr.no feed Snoflo's iOS app uses. Watch the precipitation column on the meteogram -- rain on the basin upstream typically lifts inflow 24-72 hours later.
Next 5 days, hour by hour
Temperature line with weather symbols on top, snow + rain accumulation as columns, humidity as a dotted line.
5-day forecast table
Every 3 hours, broken out across temperature, snow, rain, humidity, and wind. Each cell is colour-coded relative to the column min/max.
| Time | Condition | Temp (°F) | Snow (in) | Rain (in) | Humidity (%) | Wind (mps) | Wind dir |
|---|---|---|---|---|---|---|---|
| Loading detailed forecast… | |||||||
15-day temperature & precipitation
Daily temperatures, snow, and rain projected over the next two weeks.
Nearby streamflow gauges
USGS streamgauges around Robbs Peak -- inflows here typically show up in storage 24-72 hours later.
| Streamgauge | Discharge | View |
|---|---|---|
| Pilot C Ab Stumpy Meadows Res Ca | 3 cfs | → |
| Pilot C Bl Mutton Canyon Nr Georgetown Ca | 2 cfs | → |
| General C Nr Meeks Bay Ca | 3 cfs | → |
| Blackwood C Nr Tahoe City Ca | 4 cfs | → |
| Ward C At Hwy 89 Nr Tahoe Pines Ca | 5 cfs | → |
| Truckee R A Tahoe City Ca | 273 cfs | → |


About Robbs Peak
Where does the data for Robbs Peak come from?
Structural and regulatory data come from the U.S. Army Corps of Engineers' National Inventory of Dams (NID). Weather forecast comes from NOAA / yr.no -- the same feed Snoflo's iOS app uses.
How often is the report updated?
NID structural data refreshes annually as the Corps publishes updated assessments. The weather forecast refreshes throughout the day.
What does the Low hazard rating mean?
The Corps of Engineers' hazard potential classification grades probable consequences if the dam fails: High = probable loss of human life; Significant = no probable loss of human life but possible economic loss / environmental damage; Low = no probable loss of human life, only minor economic / environmental losses. See the Dam Data Reference card below for the full definitions.
What's "% of normal"?
The current storage value compared to the historical average storage on this calendar day. 100% = right on average; values above 100% mean above-normal storage (wet year); values below mean below-normal (dry year or drought).
Can I get alerts when storage crosses a threshold?
Yes -- alerts are managed in the Snoflo iOS app. Favorite this dam, set a threshold, and you'll get a push the moment conditions cross.
Dam data reference
Condition Assessment
- Satisfactory
- No existing or potential dam safety deficiencies are recognized. Acceptable performance is expected under all loading conditions (static, hydrologic, seismic) in accordance with the minimum applicable state or federal regulatory criteria or tolerable risk guidelines.
- Fair
- No existing dam safety deficiencies are recognized for normal operating conditions. Rare or extreme hydrologic and/or seismic events may result in a dam safety deficiency. Risk may be in the range to take further action.
- Poor
- A dam safety deficiency is recognized for normal operating conditions which may realistically occur. Remedial action is necessary. POOR may also be used when uncertainties exist as to critical analysis parameters which identify a potential dam safety deficiency.
- Unsatisfactory
- A dam safety deficiency is recognized that requires immediate or emergency remedial action for problem resolution.
- Not Rated
- The dam has not been inspected, is not under state or federal jurisdiction, or has been inspected but, for whatever reason, has not been rated.
Hazard Potential Classification
- High
- Dams assigned the high hazard potential classification are those where failure or mis-operation will probably cause loss of human life.
- Significant
- Dams assigned the significant hazard potential classification are those dams where failure or mis-operation results in no probable loss of human life but can cause economic loss, environmental damage, disruption of lifeline facilities, or impact other concerns. Significant hazard potential classification dams are often located in predominantly rural or agricultural areas but could be in areas with population and significant infrastructure.
- Low
- Dams assigned the low hazard potential classification are those where failure or mis-operation results in no probable loss of human life and low economic and/or environmental losses. Losses are principally limited to the owner's property.
- Undetermined
- Dams for which a downstream hazard potential has not been designated or is not provided.