Pit R Ph #6 Reservoir
As of July 23, 2026, Pit R Ph #6 is holding 15,137 acre-ft of water — 108% of normal storage for this date. Storage data refreshed throughout the day.

Pit R Ph #6
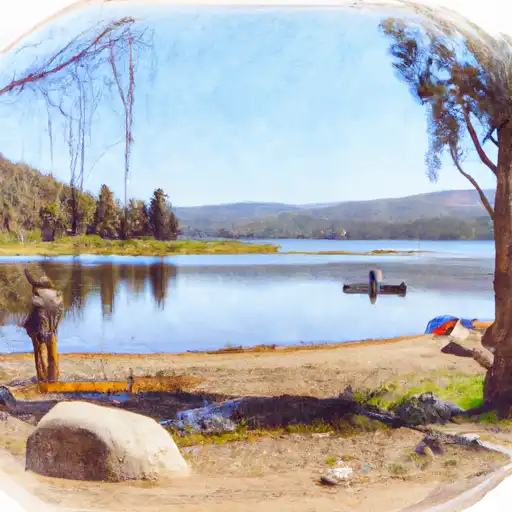
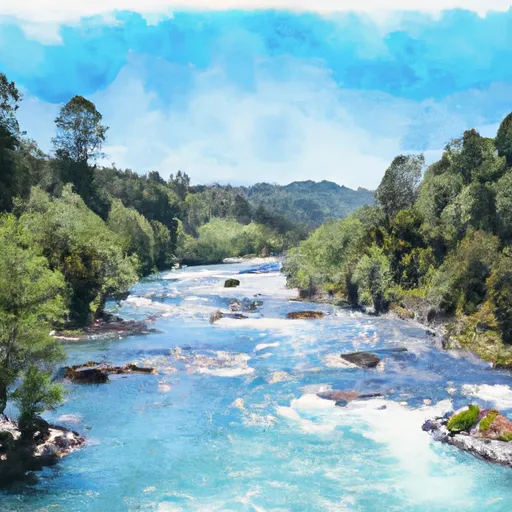
Pit River Hydroelectric Project #6 is located in northeastern California and is operated by Pacific Gas and Electric Company. The project consists of a series of hydroelectric facilities on the Pit River, with the #6 plant being the largest and most powerful. The Pit River is fed by both snowpack and surface flow, with the majority of the flow coming from snowmelt. The project's operations are closely tied to the amount and timing of snowpack, with the winter months being critical for water storage. The reservoir created by the project provides irrigation water to nearby agricultural lands, and the river is also used for recreational activities such as fishing and kayaking. The project has a long history dating back to the early 1900s and has undergone several renovations to increase its efficiency and capacity.
Daily levels at Pit R Ph #6
Storage volume, pool elevation, and total release plotted from the operating agency's daily observations.
Storage
acre-ft · code 2
Pool Elevation
ft · code 1
Plan around the weather
Same NOAA / yr.no feed Snoflo's iOS app uses. Watch the precipitation column on the meteogram -- rain on the basin upstream typically lifts inflow 24-72 hours later.
Next 5 days, hour by hour
Temperature line with weather symbols on top, snow + rain accumulation as columns, humidity as a dotted line.
5-day forecast table
Every 3 hours, broken out across temperature, snow, rain, humidity, and wind. Each cell is colour-coded relative to the column min/max.
| Time | Condition | Temp (°F) | Snow (in) | Rain (in) | Humidity (%) | Wind (mps) | Wind dir |
|---|---|---|---|---|---|---|---|
| Loading detailed forecast… | |||||||
15-day temperature & precipitation
Daily temperatures, snow, and rain projected over the next two weeks.
Nearby streamflow gauges
USGS streamgauges around Pit R Ph #6 -- inflows here typically show up in storage 24-72 hours later.
| Streamgauge | Discharge | View |
|---|---|---|
| Burney C A Burney Falls Nr Burney Ca | 168 cfs | → |
| Sacramento R A Delta Ca | 245 cfs | → |
| Cow C Nr Millville Ca | 31 cfs | → |
| Pit R Bl Pit No 1 Ph Nr Fall River Mills Ca | 1,390 cfs | → |
| Anderson-Cottonwood Id Cn At Sharon St Redding Ca | 272 cfs | → |
| Sacramento R A Keswick Ca | 13,200 cfs | → |












About Pit R Ph #6
Where does the data for Pit R Ph #6 come from?
Daily storage, pool elevation, and release rates are sourced from USGS, USBR, and USACE monitoring stations. Weather forecast comes from NOAA / yr.no -- the same feed Snoflo's iOS app uses.
How often is the report updated?
Storage observations are updated daily by the operating agency. The 15-day weather forecast refreshes throughout the day. Snoflo caches and renders the most recent observation -- check the "as of" timestamp on the storage card.
What does the Hazard hazard rating mean?
The Corps of Engineers' hazard potential classification grades probable consequences if the dam fails: High = probable loss of human life; Significant = no probable loss of human life but possible economic loss / environmental damage; Low = no probable loss of human life, only minor economic / environmental losses. See the Dam Data Reference card below for the full definitions.
What's "% of normal"?
The current storage value compared to the historical average storage on this calendar day. 100% = right on average; values above 100% mean above-normal storage (wet year); values below mean below-normal (dry year or drought).
Can I get alerts when storage crosses a threshold?
Yes -- alerts are managed in the Snoflo iOS app. Favorite this reservoir, set a threshold, and you'll get a push the moment conditions cross.