Cerro Dam

Cerro
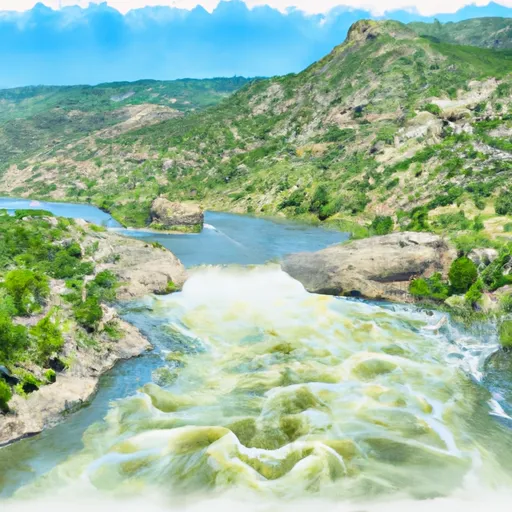
Cerro, also known as Montrose, is a vital water supply dam located in Montrose, Colorado along the Uncompahgre River. Completed in 1966, this earth dam stands at a height of 53 feet, with a hydraulic height of 67 feet and a structural height of 72 feet. It has a storage capacity of 817 acre-feet, with a normal storage level of 675 acre-feet on its 28-acre surface area. The dam serves as a key water resource for the local government and is regulated by the Colorado Department of Water Resources, ensuring its proper operation and maintenance.
Despite being categorized as a high hazard potential structure, Cerro is assessed to be in fair condition as of August 2020. It features a spillway width of 10 feet and outlet gates including slide gates, uncontrolled gates, and valves. The dam has a maximum discharge capacity of 790 cubic feet per second and has undergone regular inspections, with the last one conducted in August 2020. With a risk assessment rating of high (2), measures are in place to manage potential risks associated with the dam, although specific risk management details are not provided in the data.
Located within the jurisdiction of the Albuquerque District of the US Army Corps of Engineers, Cerro plays a crucial role in water supply management for the region. Its presence ensures a stable water source for the community, while ongoing monitoring and maintenance uphold its structural integrity and operational safety. For water resource and climate enthusiasts, Cerro serves as a noteworthy example of infrastructure that contributes to sustainable water management practices in the face of changing environmental conditions.
Plan around the weather
Same NOAA / yr.no feed Snoflo's iOS app uses. Watch the precipitation column on the meteogram -- rain on the basin upstream typically lifts inflow 24-72 hours later.
Next 5 days, hour by hour
Temperature line with weather symbols on top, snow + rain accumulation as columns, humidity as a dotted line.
5-day forecast table
Every 3 hours, broken out across temperature, snow, rain, humidity, and wind. Each cell is colour-coded relative to the column min/max.
| Time | Condition | Temp (°F) | Snow (in) | Rain (in) | Humidity (%) | Wind (mps) | Wind dir |
|---|---|---|---|---|---|---|---|
| Loading detailed forecast… | |||||||
15-day temperature & precipitation
Daily temperatures, snow, and rain projected over the next two weeks.
Nearby streamflow gauges
USGS streamgauges around Cerro -- inflows here typically show up in storage 24-72 hours later.
| Streamgauge | Discharge | View |
|---|---|---|
| Cimarron River Bl Squaw Creek | 11 cfs | → |
| Gunnison River Below Gunnison Tunnel | 261 cfs | → |
| Uncompahgre River At Colona | 103 cfs | → |
| Cimarron River Near Cimarron | 73 cfs | → |
| Uncompahgre River Below Ridgway Reservoir | 144 cfs | → |
| Smith Fork Near Lazear | · | → |
Make a day of it
Boat launches, lakeside camping, fishing access, and other reservoirs near Cerro.
Boat launches
See all →


Campgrounds
See all →


Fishing spots
See all →


River runs
See all →


About Cerro
Where does the data for Cerro come from?
Structural and regulatory data come from the U.S. Army Corps of Engineers' National Inventory of Dams (NID). Weather forecast comes from NOAA / yr.no -- the same feed Snoflo's iOS app uses.
How often is the report updated?
NID structural data refreshes annually as the Corps publishes updated assessments. The weather forecast refreshes throughout the day.
What does the High hazard rating mean?
The Corps of Engineers' hazard potential classification grades probable consequences if the dam fails: High = probable loss of human life; Significant = no probable loss of human life but possible economic loss / environmental damage; Low = no probable loss of human life, only minor economic / environmental losses. See the Dam Data Reference card below for the full definitions.
What's "% of normal"?
The current storage value compared to the historical average storage on this calendar day. 100% = right on average; values above 100% mean above-normal storage (wet year); values below mean below-normal (dry year or drought).
Can I get alerts when storage crosses a threshold?
Yes -- alerts are managed in the Snoflo iOS app. Favorite this dam, set a threshold, and you'll get a push the moment conditions cross.
Dam data reference
Condition Assessment
- Satisfactory
- No existing or potential dam safety deficiencies are recognized. Acceptable performance is expected under all loading conditions (static, hydrologic, seismic) in accordance with the minimum applicable state or federal regulatory criteria or tolerable risk guidelines.
- Fair
- No existing dam safety deficiencies are recognized for normal operating conditions. Rare or extreme hydrologic and/or seismic events may result in a dam safety deficiency. Risk may be in the range to take further action.
- Poor
- A dam safety deficiency is recognized for normal operating conditions which may realistically occur. Remedial action is necessary. POOR may also be used when uncertainties exist as to critical analysis parameters which identify a potential dam safety deficiency.
- Unsatisfactory
- A dam safety deficiency is recognized that requires immediate or emergency remedial action for problem resolution.
- Not Rated
- The dam has not been inspected, is not under state or federal jurisdiction, or has been inspected but, for whatever reason, has not been rated.
Hazard Potential Classification
- High
- Dams assigned the high hazard potential classification are those where failure or mis-operation will probably cause loss of human life.
- Significant
- Dams assigned the significant hazard potential classification are those dams where failure or mis-operation results in no probable loss of human life but can cause economic loss, environmental damage, disruption of lifeline facilities, or impact other concerns. Significant hazard potential classification dams are often located in predominantly rural or agricultural areas but could be in areas with population and significant infrastructure.
- Low
- Dams assigned the low hazard potential classification are those where failure or mis-operation results in no probable loss of human life and low economic and/or environmental losses. Losses are principally limited to the owner's property.
- Undetermined
- Dams for which a downstream hazard potential has not been designated or is not provided.