Gurley Dam

Gurley
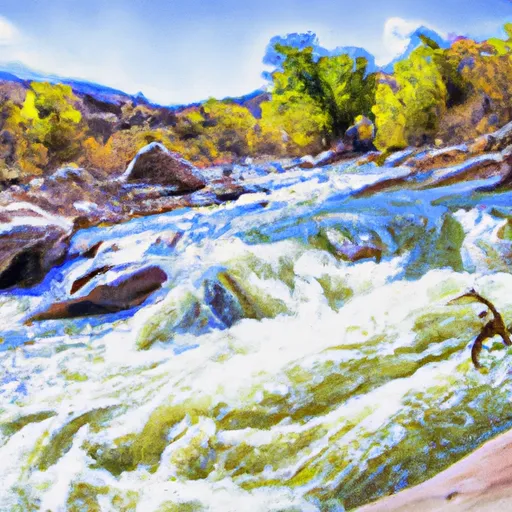
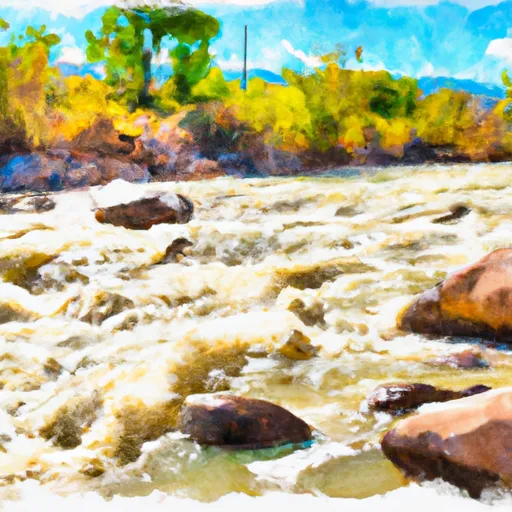
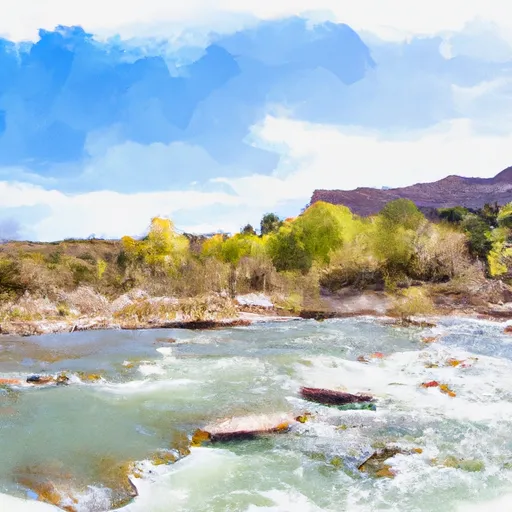
Located in the picturesque Gurley Canyon, the Gurley dam in Colorado serves as a vital irrigation resource for the surrounding area. Built in 1961, this private-owned earth dam stands at a height of 64 feet, with a maximum storage capacity of 10,511 acre-feet. Despite its essential role in water management, the dam's condition assessment was marked as unsatisfactory during its last inspection in July 2020, highlighting the need for ongoing maintenance and management to ensure its safety and functionality.
With a hazard potential rated as high, the Gurley dam presents a significant risk that must be carefully managed. The dam lacks a spillway and is equipped with slide gates and uncontrolled outlets, adding to its vulnerability in the event of high discharge. The surrounding community, including the city of Norwood, relies on the dam for irrigation purposes, making it crucial to address any safety concerns promptly and effectively. As a regulated structure under the jurisdiction of the Colorado Division of Water Resources, ongoing inspections and enforcement measures are in place to mitigate potential risks and ensure the dam's stability.
In light of its critical role in water resource management, the Gurley dam serves as a focal point for climate and water resource enthusiasts. Its location in the scenic Gurley Canyon and its impact on the local ecosystem make it a compelling subject for further study and monitoring. As efforts continue to maintain and improve the dam's condition, it remains a key piece of infrastructure in Colorado's water management network, highlighting the importance of sustainable practices and risk assessment in safeguarding vital resources for future generations.
Plan around the weather
Same NOAA / yr.no feed Snoflo's iOS app uses. Watch the precipitation column on the meteogram -- rain on the basin upstream typically lifts inflow 24-72 hours later.
Next 5 days, hour by hour
Temperature line with weather symbols on top, snow + rain accumulation as columns, humidity as a dotted line.
5-day forecast table
Every 3 hours, broken out across temperature, snow, rain, humidity, and wind. Each cell is colour-coded relative to the column min/max.
| Time | Condition | Temp (°F) | Snow (in) | Rain (in) | Humidity (%) | Wind (mps) | Wind dir |
|---|---|---|---|---|---|---|---|
| Loading detailed forecast… | |||||||
15-day temperature & precipitation
Daily temperatures, snow, and rain projected over the next two weeks.
Nearby streamflow gauges
USGS streamgauges around Gurley -- inflows here typically show up in storage 24-72 hours later.
| Streamgauge | Discharge | View |
|---|---|---|
| San Miguel River Near Placerville | 125 cfs | → |
| San Miguel River At Brooks Bridge Near Nucla Co | 38 cfs | → |
| South Fork San Miguel River Near Ophir | 43 cfs | → |
| Dallas Creek Near Ridgway | 3 cfs | → |
| Dolores River Below Rico | 43 cfs | → |
| Uncompahgre River Near Ridgway | 69 cfs | → |


About Gurley
Where does the data for Gurley come from?
Structural and regulatory data come from the U.S. Army Corps of Engineers' National Inventory of Dams (NID). Weather forecast comes from NOAA / yr.no -- the same feed Snoflo's iOS app uses.
How often is the report updated?
NID structural data refreshes annually as the Corps publishes updated assessments. The weather forecast refreshes throughout the day.
What does the High hazard rating mean?
The Corps of Engineers' hazard potential classification grades probable consequences if the dam fails: High = probable loss of human life; Significant = no probable loss of human life but possible economic loss / environmental damage; Low = no probable loss of human life, only minor economic / environmental losses. See the Dam Data Reference card below for the full definitions.
What's "% of normal"?
The current storage value compared to the historical average storage on this calendar day. 100% = right on average; values above 100% mean above-normal storage (wet year); values below mean below-normal (dry year or drought).
Can I get alerts when storage crosses a threshold?
Yes -- alerts are managed in the Snoflo iOS app. Favorite this dam, set a threshold, and you'll get a push the moment conditions cross.
Dam data reference
Condition Assessment
- Satisfactory
- No existing or potential dam safety deficiencies are recognized. Acceptable performance is expected under all loading conditions (static, hydrologic, seismic) in accordance with the minimum applicable state or federal regulatory criteria or tolerable risk guidelines.
- Fair
- No existing dam safety deficiencies are recognized for normal operating conditions. Rare or extreme hydrologic and/or seismic events may result in a dam safety deficiency. Risk may be in the range to take further action.
- Poor
- A dam safety deficiency is recognized for normal operating conditions which may realistically occur. Remedial action is necessary. POOR may also be used when uncertainties exist as to critical analysis parameters which identify a potential dam safety deficiency.
- Unsatisfactory
- A dam safety deficiency is recognized that requires immediate or emergency remedial action for problem resolution.
- Not Rated
- The dam has not been inspected, is not under state or federal jurisdiction, or has been inspected but, for whatever reason, has not been rated.
Hazard Potential Classification
- High
- Dams assigned the high hazard potential classification are those where failure or mis-operation will probably cause loss of human life.
- Significant
- Dams assigned the significant hazard potential classification are those dams where failure or mis-operation results in no probable loss of human life but can cause economic loss, environmental damage, disruption of lifeline facilities, or impact other concerns. Significant hazard potential classification dams are often located in predominantly rural or agricultural areas but could be in areas with population and significant infrastructure.
- Low
- Dams assigned the low hazard potential classification are those where failure or mis-operation results in no probable loss of human life and low economic and/or environmental losses. Losses are principally limited to the owner's property.
- Undetermined
- Dams for which a downstream hazard potential has not been designated or is not provided.