Jordan Dam

Jordan Dam
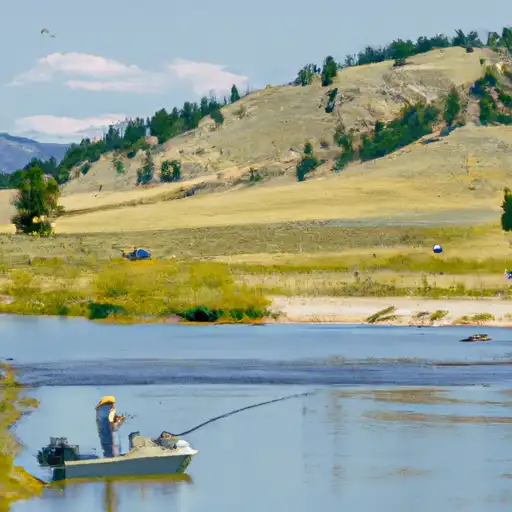
Jordan Dam, located in Wilsall, Montana, was completed in 1961 by the USDA NRCS and serves primarily for irrigation purposes on the TR-Antelope Creek. With a height of 38 feet and a hydraulic height of 35 feet, the dam has a storage capacity of 1,260 acre-feet and covers a surface area of 87 acres. Despite its significant storage capacity, the dam has a poor condition assessment and is classified as having a high hazard potential.
The dam, owned privately, is regulated by the State of Montana through the Department of Natural Resources and Conservation (DNRC). It is subject to state permitting, inspection, and enforcement, ensuring compliance with safety standards. However, the last inspection was conducted in 2015, indicating a potential need for more frequent assessments to address the poor condition and high hazard potential of the structure.
For water resource and climate enthusiasts, Jordan Dam represents a critical infrastructure supporting agriculture in the region. Its location in Park County, Montana, makes it a key component of the local irrigation system. As discussions around water resource management and climate resilience continue to gain importance, the condition and safety of dams like Jordan Dam will be crucial in ensuring sustainable water usage and mitigating risks associated with potential dam failures.
Plan around the weather
Same NOAA / yr.no feed Snoflo's iOS app uses. Watch the precipitation column on the meteogram -- rain on the basin upstream typically lifts inflow 24-72 hours later.
Next 5 days, hour by hour
Temperature line with weather symbols on top, snow + rain accumulation as columns, humidity as a dotted line.
5-day forecast table
Every 3 hours, broken out across temperature, snow, rain, humidity, and wind. Each cell is colour-coded relative to the column min/max.
| Time | Condition | Temp (°F) | Snow (in) | Rain (in) | Humidity (%) | Wind (mps) | Wind dir |
|---|---|---|---|---|---|---|---|
| Loading detailed forecast… | |||||||
15-day temperature & precipitation
Daily temperatures, snow, and rain projected over the next two weeks.
Nearby streamflow gauges
USGS streamgauges around Jordan Dam -- inflows here typically show up in storage 24-72 hours later.
| Streamgauge | Discharge | View |
|---|---|---|
| Shields River Nr Livingston Mt | 119 cfs | → |
| South Fork Musselshell R Ab Martinsdale Mt | 43 cfs | → |
| Musselshell River Nr Martinsdale | 24 cfs | → |
| Yellowstone River Near Livingston Mt | 3,450 cfs | → |
| Missouri River At Toston Mt | 4,030 cfs | → |
| Boulder River At Big Timber Mt | 274 cfs | → |


About Jordan Dam
Where does the data for Jordan Dam come from?
Structural and regulatory data come from the U.S. Army Corps of Engineers' National Inventory of Dams (NID). Weather forecast comes from NOAA / yr.no -- the same feed Snoflo's iOS app uses.
How often is the report updated?
NID structural data refreshes annually as the Corps publishes updated assessments. The weather forecast refreshes throughout the day.
What does the High hazard rating mean?
The Corps of Engineers' hazard potential classification grades probable consequences if the dam fails: High = probable loss of human life; Significant = no probable loss of human life but possible economic loss / environmental damage; Low = no probable loss of human life, only minor economic / environmental losses. See the Dam Data Reference card below for the full definitions.
What's "% of normal"?
The current storage value compared to the historical average storage on this calendar day. 100% = right on average; values above 100% mean above-normal storage (wet year); values below mean below-normal (dry year or drought).
Can I get alerts when storage crosses a threshold?
Yes -- alerts are managed in the Snoflo iOS app. Favorite this dam, set a threshold, and you'll get a push the moment conditions cross.
Dam data reference
Condition Assessment
- Satisfactory
- No existing or potential dam safety deficiencies are recognized. Acceptable performance is expected under all loading conditions (static, hydrologic, seismic) in accordance with the minimum applicable state or federal regulatory criteria or tolerable risk guidelines.
- Fair
- No existing dam safety deficiencies are recognized for normal operating conditions. Rare or extreme hydrologic and/or seismic events may result in a dam safety deficiency. Risk may be in the range to take further action.
- Poor
- A dam safety deficiency is recognized for normal operating conditions which may realistically occur. Remedial action is necessary. POOR may also be used when uncertainties exist as to critical analysis parameters which identify a potential dam safety deficiency.
- Unsatisfactory
- A dam safety deficiency is recognized that requires immediate or emergency remedial action for problem resolution.
- Not Rated
- The dam has not been inspected, is not under state or federal jurisdiction, or has been inspected but, for whatever reason, has not been rated.
Hazard Potential Classification
- High
- Dams assigned the high hazard potential classification are those where failure or mis-operation will probably cause loss of human life.
- Significant
- Dams assigned the significant hazard potential classification are those dams where failure or mis-operation results in no probable loss of human life but can cause economic loss, environmental damage, disruption of lifeline facilities, or impact other concerns. Significant hazard potential classification dams are often located in predominantly rural or agricultural areas but could be in areas with population and significant infrastructure.
- Low
- Dams assigned the low hazard potential classification are those where failure or mis-operation results in no probable loss of human life and low economic and/or environmental losses. Losses are principally limited to the owner's property.
- Undetermined
- Dams for which a downstream hazard potential has not been designated or is not provided.