Little Sleeping Child Creek Dam

Little Sleeping Child Creek Dam
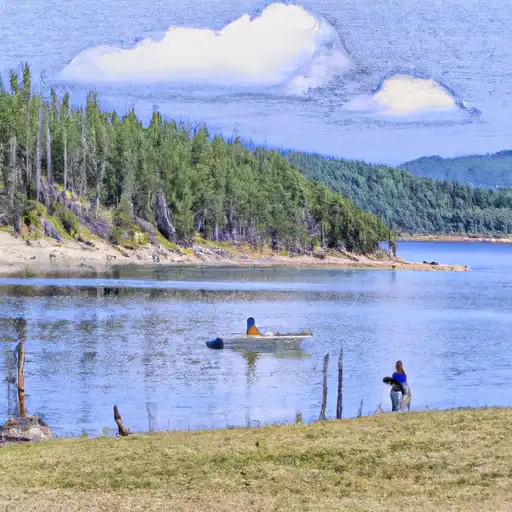
The Little Sleeping Child Creek Dam in Ravalli, Montana, is a private earth dam completed in 1927 for recreation and irrigation purposes. Standing at a height of 34.5 feet, the dam controls the flow of the Little Sleeping Child Creek and has a storage capacity of 73 acre-feet. Despite its age, the dam has a high hazard potential and is currently in poor condition, as noted in the most recent inspection in April 2022.
Located in the Seattle District and regulated by the Montana Department of Natural Resources and Conservation (DNRC), the dam poses a moderate risk to surrounding areas. With a maximum discharge of 800 cubic feet per second, the dam's uncontrolled spillway type may be a cause for concern in case of emergencies. The dam has not undergone significant modifications in recent years, and its emergency action plan (EAP) and risk management measures may need to be updated to meet current guidelines.
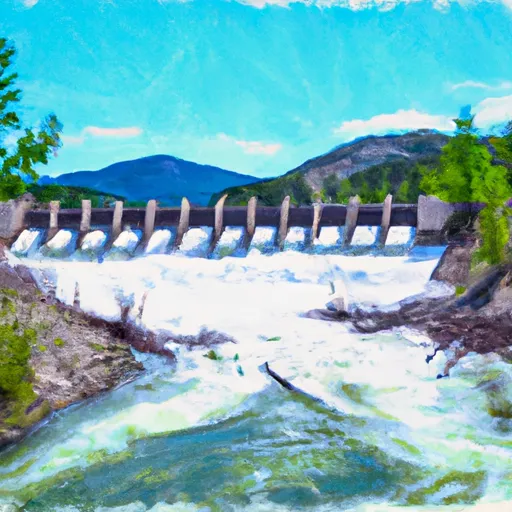
As a significant structure in the region, the Little Sleeping Child Creek Dam serves as a reminder of the importance of maintaining and monitoring aging infrastructure to ensure the safety of both the environment and local communities. With proper maintenance and oversight, the dam can continue to fulfill its recreational and irrigation purposes while minimizing risks to downstream areas.
Plan around the weather
Same NOAA / yr.no feed Snoflo's iOS app uses. Watch the precipitation column on the meteogram -- rain on the basin upstream typically lifts inflow 24-72 hours later.
Next 5 days, hour by hour
Temperature line with weather symbols on top, snow + rain accumulation as columns, humidity as a dotted line.
5-day forecast table
Every 3 hours, broken out across temperature, snow, rain, humidity, and wind. Each cell is colour-coded relative to the column min/max.
| Time | Condition | Temp (°F) | Snow (in) | Rain (in) | Humidity (%) | Wind (mps) | Wind dir |
|---|---|---|---|---|---|---|---|
| Loading detailed forecast… | |||||||
15-day temperature & precipitation
Daily temperatures, snow, and rain projected over the next two weeks.
Nearby streamflow gauges
USGS streamgauges around Little Sleeping Child Creek Dam -- inflows here typically show up in storage 24-72 hours later.
| Streamgauge | Discharge | View |
|---|---|---|
| Bitterroot River Near Darby Mt | 411 cfs | → |
| Bitterroot River At Bell Crossing Nr Victor Mt | 308 cfs | → |
| West Fork Bitterroot River Nr Conner Mt | 135 cfs | → |
| Middle Fork Rock Cr Nr Philipsburg Mt | 110 cfs | → |
| Flint Creek Near Southern Cross Mt | 33 cfs | → |
| Big Hole River Bl Mudd Cr Nr Wisdom Mt | 343 cfs | → |
Make a day of it
Boat launches, lakeside camping, fishing access, and other reservoirs near Little Sleeping Child Creek Dam.
Boat launches
See all →


Campgrounds
See all →


Fishing spots
See all →


River runs
See all →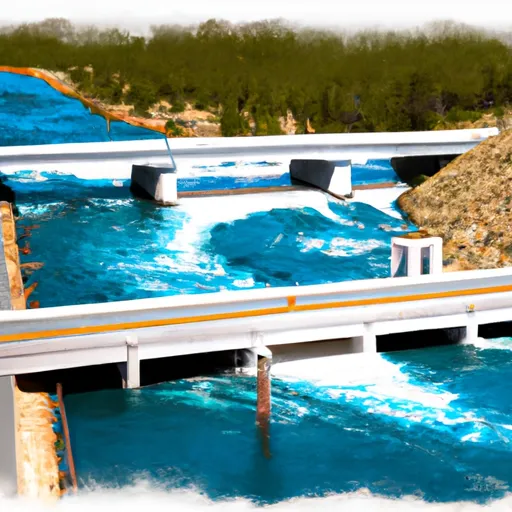


About Little Sleeping Child Creek Dam
Where does the data for Little Sleeping Child Creek Dam come from?
Structural and regulatory data come from the U.S. Army Corps of Engineers' National Inventory of Dams (NID). Weather forecast comes from NOAA / yr.no -- the same feed Snoflo's iOS app uses.
How often is the report updated?
NID structural data refreshes annually as the Corps publishes updated assessments. The weather forecast refreshes throughout the day.
What does the High hazard rating mean?
The Corps of Engineers' hazard potential classification grades probable consequences if the dam fails: High = probable loss of human life; Significant = no probable loss of human life but possible economic loss / environmental damage; Low = no probable loss of human life, only minor economic / environmental losses. See the Dam Data Reference card below for the full definitions.
What's "% of normal"?
The current storage value compared to the historical average storage on this calendar day. 100% = right on average; values above 100% mean above-normal storage (wet year); values below mean below-normal (dry year or drought).
Can I get alerts when storage crosses a threshold?
Yes -- alerts are managed in the Snoflo iOS app. Favorite this dam, set a threshold, and you'll get a push the moment conditions cross.
Dam data reference
Condition Assessment
- Satisfactory
- No existing or potential dam safety deficiencies are recognized. Acceptable performance is expected under all loading conditions (static, hydrologic, seismic) in accordance with the minimum applicable state or federal regulatory criteria or tolerable risk guidelines.
- Fair
- No existing dam safety deficiencies are recognized for normal operating conditions. Rare or extreme hydrologic and/or seismic events may result in a dam safety deficiency. Risk may be in the range to take further action.
- Poor
- A dam safety deficiency is recognized for normal operating conditions which may realistically occur. Remedial action is necessary. POOR may also be used when uncertainties exist as to critical analysis parameters which identify a potential dam safety deficiency.
- Unsatisfactory
- A dam safety deficiency is recognized that requires immediate or emergency remedial action for problem resolution.
- Not Rated
- The dam has not been inspected, is not under state or federal jurisdiction, or has been inspected but, for whatever reason, has not been rated.
Hazard Potential Classification
- High
- Dams assigned the high hazard potential classification are those where failure or mis-operation will probably cause loss of human life.
- Significant
- Dams assigned the significant hazard potential classification are those dams where failure or mis-operation results in no probable loss of human life but can cause economic loss, environmental damage, disruption of lifeline facilities, or impact other concerns. Significant hazard potential classification dams are often located in predominantly rural or agricultural areas but could be in areas with population and significant infrastructure.
- Low
- Dams assigned the low hazard potential classification are those where failure or mis-operation results in no probable loss of human life and low economic and/or environmental losses. Losses are principally limited to the owner's property.
- Undetermined
- Dams for which a downstream hazard potential has not been designated or is not provided.