Washburn Corners Dam Dam

Washburn Corners Dam
Located in Springfield, New Hampshire, the Washburn Corners Dam, also known as Bog Brook Dam, stands as a recreational marvel in the Sullivan County region. Completed in 1957, this earth and stone dam boasts a height of 13.5 feet and a length of 289 feet, offering visitors a serene escape with a surface area of 202 acres and a drainage area of 12.1 square miles. The dam, regulated and inspected by the NHDES Dam Bureau, serves as a vital recreational hub with a low hazard potential and a satisfactory condition assessment.
With a primary purpose of recreation, the Washburn Corners Dam provides a vital source of enjoyment for locals and visitors alike. Its controlled spillway, with a width of 71 feet, ensures the safety and stability of the surrounding area, while the dam's moderate risk assessment indicates a proactive approach to risk management. Despite its age, the Washburn Corners Dam remains a popular destination for water resource and climate enthusiasts, offering a glimpse into the region's natural beauty and recreational opportunities.
As a state-regulated and permitted structure, the Washburn Corners Dam stands as a testament to responsible water resource management in New Hampshire. With a history dating back to the mid-20th century, this dam continues to serve as a cornerstone of recreational activities in the area, attracting outdoor enthusiasts and nature lovers year-round. For those seeking a tranquil escape or a deeper understanding of water resource infrastructure, the Washburn Corners Dam offers a captivating blend of history, functionality, and natural beauty.
Plan around the weather
Same NOAA / yr.no feed Snoflo's iOS app uses. Watch the precipitation column on the meteogram -- rain on the basin upstream typically lifts inflow 24-72 hours later.
Next 5 days, hour by hour
Temperature line with weather symbols on top, snow + rain accumulation as columns, humidity as a dotted line.
5-day forecast table
Every 3 hours, broken out across temperature, snow, rain, humidity, and wind. Each cell is colour-coded relative to the column min/max.
| Time | Condition | Temp (°F) | Snow (in) | Rain (in) | Humidity (%) | Wind (mps) | Wind dir |
|---|---|---|---|---|---|---|---|
| Loading detailed forecast… | |||||||
15-day temperature & precipitation
Daily temperatures, snow, and rain projected over the next two weeks.
Nearby streamflow gauges
USGS streamgauges around Washburn Corners Dam -- inflows here typically show up in storage 24-72 hours later.
| Streamgauge | Discharge | View |
|---|---|---|
| Connecticut River At West Lebanon | 2,570 cfs | → |
| Ottauquechee River At North Hartland | 319 cfs | → |
| Smith River Near Bristol | 25 cfs | → |
| Sugar River At West Claremont | 118 cfs | → |
| Ompompanoosuc River At Union Village | 16 cfs | → |
| White River At West Hartford | 390 cfs | → |
Make a day of it
Boat launches, lakeside camping, fishing access, and other reservoirs near Washburn Corners Dam.
Boat launches
See all →


Campgrounds
See all →


River runs
See all →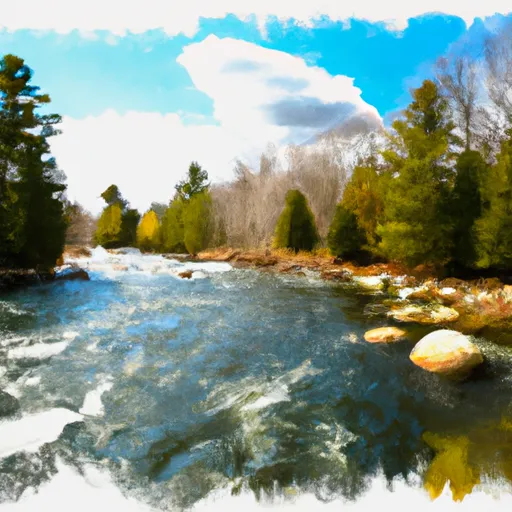


About Washburn Corners Dam
Where does the data for Washburn Corners Dam come from?
Structural and regulatory data come from the U.S. Army Corps of Engineers' National Inventory of Dams (NID). Weather forecast comes from NOAA / yr.no -- the same feed Snoflo's iOS app uses.
How often is the report updated?
NID structural data refreshes annually as the Corps publishes updated assessments. The weather forecast refreshes throughout the day.
What does the Low hazard rating mean?
The Corps of Engineers' hazard potential classification grades probable consequences if the dam fails: High = probable loss of human life; Significant = no probable loss of human life but possible economic loss / environmental damage; Low = no probable loss of human life, only minor economic / environmental losses. See the Dam Data Reference card below for the full definitions.
What's "% of normal"?
The current storage value compared to the historical average storage on this calendar day. 100% = right on average; values above 100% mean above-normal storage (wet year); values below mean below-normal (dry year or drought).
Can I get alerts when storage crosses a threshold?
Yes -- alerts are managed in the Snoflo iOS app. Favorite this dam, set a threshold, and you'll get a push the moment conditions cross.
Dam data reference
Condition Assessment
- Satisfactory
- No existing or potential dam safety deficiencies are recognized. Acceptable performance is expected under all loading conditions (static, hydrologic, seismic) in accordance with the minimum applicable state or federal regulatory criteria or tolerable risk guidelines.
- Fair
- No existing dam safety deficiencies are recognized for normal operating conditions. Rare or extreme hydrologic and/or seismic events may result in a dam safety deficiency. Risk may be in the range to take further action.
- Poor
- A dam safety deficiency is recognized for normal operating conditions which may realistically occur. Remedial action is necessary. POOR may also be used when uncertainties exist as to critical analysis parameters which identify a potential dam safety deficiency.
- Unsatisfactory
- A dam safety deficiency is recognized that requires immediate or emergency remedial action for problem resolution.
- Not Rated
- The dam has not been inspected, is not under state or federal jurisdiction, or has been inspected but, for whatever reason, has not been rated.
Hazard Potential Classification
- High
- Dams assigned the high hazard potential classification are those where failure or mis-operation will probably cause loss of human life.
- Significant
- Dams assigned the significant hazard potential classification are those dams where failure or mis-operation results in no probable loss of human life but can cause economic loss, environmental damage, disruption of lifeline facilities, or impact other concerns. Significant hazard potential classification dams are often located in predominantly rural or agricultural areas but could be in areas with population and significant infrastructure.
- Low
- Dams assigned the low hazard potential classification are those where failure or mis-operation results in no probable loss of human life and low economic and/or environmental losses. Losses are principally limited to the owner's property.
- Undetermined
- Dams for which a downstream hazard potential has not been designated or is not provided.