Star Lake Dam

Star Lake
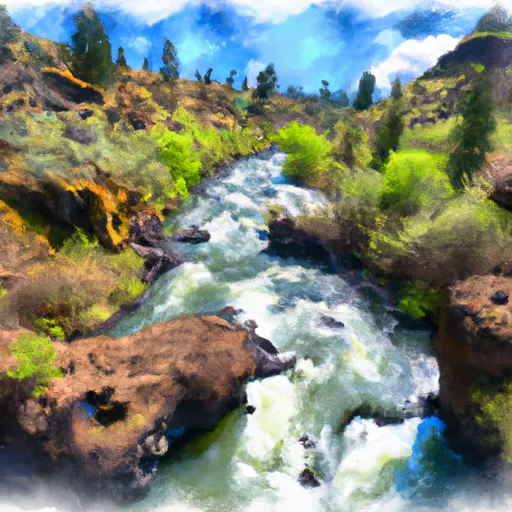
Star Lake, located in Jackson, Oregon, serves as a vital water resource for irrigation purposes in the region. Built in 1964, this private earth dam stands at a height of 53 feet and has a storage capacity of 290 acre-feet. The dam spans 800 feet in length and covers a surface area of 15.8 acres, with a drainage area of 0.84 square miles. Despite its age, the dam's hazard potential is rated as low, with a moderate risk assessment of level 3.
The lake is situated along Lick Creek and is regulated by the Oregon Water Resources Department, ensuring proper permitting, inspection, and enforcement measures are in place to maintain its integrity. With a spillway type classified as uncontrolled, Star Lake has a maximum discharge capacity of 50 cfs. Although the condition assessment is currently not rated, the dam undergoes regular inspections every 6 years to monitor its safety and functionality. While the emergency action plan status and risk management measures for the dam are unspecified, the overall risk assessment remains at a moderate level.
Owned and operated by a private entity, Star Lake plays a crucial role in sustaining agricultural activities in the surrounding area. As climate change continues to impact water resources, the proper maintenance and regulation of dams like Star Lake are essential to mitigating risks and ensuring a reliable water supply for the community. This serene body of water, nestled in the picturesque landscape of Brownsboro, serves as a reminder of the delicate balance between human intervention and natural ecosystems in managing water resources for the future.
Plan around the weather
Same NOAA / yr.no feed Snoflo's iOS app uses. Watch the precipitation column on the meteogram -- rain on the basin upstream typically lifts inflow 24-72 hours later.
Next 5 days, hour by hour
Temperature line with weather symbols on top, snow + rain accumulation as columns, humidity as a dotted line.
5-day forecast table
Every 3 hours, broken out across temperature, snow, rain, humidity, and wind. Each cell is colour-coded relative to the column min/max.
| Time | Condition | Temp (°F) | Snow (in) | Rain (in) | Humidity (%) | Wind (mps) | Wind dir |
|---|---|---|---|---|---|---|---|
| Loading detailed forecast… | |||||||
15-day temperature & precipitation
Daily temperatures, snow, and rain projected over the next two weeks.
Nearby streamflow gauges
USGS streamgauges around Star Lake -- inflows here typically show up in storage 24-72 hours later.
| Streamgauge | Discharge | View |
|---|---|---|
| Big Butte Creek Near Mcleod | 23 cfs | → |
| Rogue River At Dodge Bridge | 1,530 cfs | → |
| Rogue River Near Mcleod | 1,450 cfs | → |
| Rogue R At Cole M Rivers F Hatchery Nr Mcleod | 1,090 cfs | → |
| Elk Creek Near Trail | 1 cfs | → |
| Bear Creek At Medford | 35 cfs | → |


About Star Lake
Where does the data for Star Lake come from?
Structural and regulatory data come from the U.S. Army Corps of Engineers' National Inventory of Dams (NID). Weather forecast comes from NOAA / yr.no -- the same feed Snoflo's iOS app uses.
How often is the report updated?
NID structural data refreshes annually as the Corps publishes updated assessments. The weather forecast refreshes throughout the day.
What does the Low hazard rating mean?
The Corps of Engineers' hazard potential classification grades probable consequences if the dam fails: High = probable loss of human life; Significant = no probable loss of human life but possible economic loss / environmental damage; Low = no probable loss of human life, only minor economic / environmental losses. See the Dam Data Reference card below for the full definitions.
What's "% of normal"?
The current storage value compared to the historical average storage on this calendar day. 100% = right on average; values above 100% mean above-normal storage (wet year); values below mean below-normal (dry year or drought).
Can I get alerts when storage crosses a threshold?
Yes -- alerts are managed in the Snoflo iOS app. Favorite this dam, set a threshold, and you'll get a push the moment conditions cross.
Dam data reference
Condition Assessment
- Satisfactory
- No existing or potential dam safety deficiencies are recognized. Acceptable performance is expected under all loading conditions (static, hydrologic, seismic) in accordance with the minimum applicable state or federal regulatory criteria or tolerable risk guidelines.
- Fair
- No existing dam safety deficiencies are recognized for normal operating conditions. Rare or extreme hydrologic and/or seismic events may result in a dam safety deficiency. Risk may be in the range to take further action.
- Poor
- A dam safety deficiency is recognized for normal operating conditions which may realistically occur. Remedial action is necessary. POOR may also be used when uncertainties exist as to critical analysis parameters which identify a potential dam safety deficiency.
- Unsatisfactory
- A dam safety deficiency is recognized that requires immediate or emergency remedial action for problem resolution.
- Not Rated
- The dam has not been inspected, is not under state or federal jurisdiction, or has been inspected but, for whatever reason, has not been rated.
Hazard Potential Classification
- High
- Dams assigned the high hazard potential classification are those where failure or mis-operation will probably cause loss of human life.
- Significant
- Dams assigned the significant hazard potential classification are those dams where failure or mis-operation results in no probable loss of human life but can cause economic loss, environmental damage, disruption of lifeline facilities, or impact other concerns. Significant hazard potential classification dams are often located in predominantly rural or agricultural areas but could be in areas with population and significant infrastructure.
- Low
- Dams assigned the low hazard potential classification are those where failure or mis-operation results in no probable loss of human life and low economic and/or environmental losses. Losses are principally limited to the owner's property.
- Undetermined
- Dams for which a downstream hazard potential has not been designated or is not provided.