Sunriver Effluent Lagoon Dam

Sunriver Effluent Lagoon
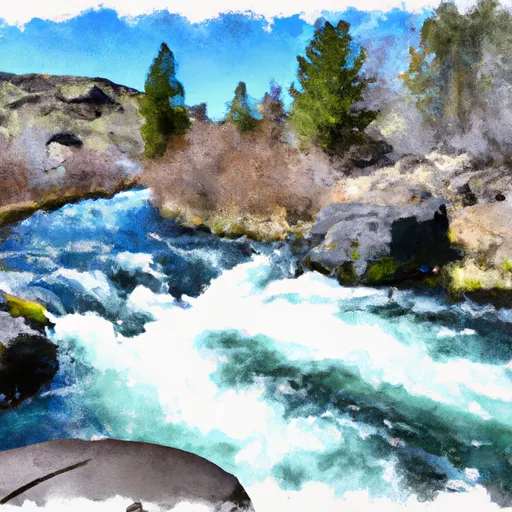
Sunriver Effluent Lagoon, also known as Lake Penhollow, is a privately owned water resource located in Deschutes, Oregon. This off-channel lagoon was designed by Dave Evans and is regulated by the Oregon Water Resources Department. Completed in 1998, the earth dam stands at a height of 30 feet, with a maximum storage capacity of 244 acre-feet and a normal storage level of 202.4 acre-feet. The lagoon covers an area of 13.4 acres and plays a crucial role in water management in the region.
With a high hazard potential but a satisfactory condition assessment as of October 2020, Sunriver Effluent Lagoon is subject to regular inspections to ensure its safety and functionality. The lagoon primarily serves purposes beyond flood control and irrigation, reflecting its unique role in the local water resource infrastructure. The lagoon's proximity to the Portland District of the US Army Corps of Engineers highlights its significance in the area's water management and environmental conservation efforts.
As a key water resource in Oregon, Sunriver Effluent Lagoon stands as a testament to effective dam design and regulation. Its role in maintaining water quality and supporting local ecosystems underscores the importance of responsible water management practices in the face of climate change and increasing water scarcity. Enthusiasts of water resources and climate resilience can appreciate the complexities and significance of this privately owned lagoon in Deschutes County, Oregon.
Plan around the weather
Same NOAA / yr.no feed Snoflo's iOS app uses. Watch the precipitation column on the meteogram -- rain on the basin upstream typically lifts inflow 24-72 hours later.
Next 5 days, hour by hour
Temperature line with weather symbols on top, snow + rain accumulation as columns, humidity as a dotted line.
5-day forecast table
Every 3 hours, broken out across temperature, snow, rain, humidity, and wind. Each cell is colour-coded relative to the column min/max.
| Time | Condition | Temp (°F) | Snow (in) | Rain (in) | Humidity (%) | Wind (mps) | Wind dir |
|---|---|---|---|---|---|---|---|
| Loading detailed forecast… | |||||||
15-day temperature & precipitation
Daily temperatures, snow, and rain projected over the next two weeks.
Nearby streamflow gauges
USGS streamgauges around Sunriver Effluent Lagoon -- inflows here typically show up in storage 24-72 hours later.
| Streamgauge | Discharge | View |
|---|---|---|
| Crooked River Blw Osborne Canyon | 129 cfs | → |
| Mckenzie R Blw Trail Br Dam Nr Belknap Springs | 634 cfs | → |
| Mckenzie River Bl Payne Cr | 171 cfs | → |
| So Fk Mckenzie River Abv Cougar Lake Nr Rainbow Or | 207 cfs | → |
| Smith River Abv Trail Brdg Resv Nr Belknap Springs | 6 cfs | → |
| Crooked River Below Opal Springs | 1,160 cfs | → |


About Sunriver Effluent Lagoon
Where does the data for Sunriver Effluent Lagoon come from?
Structural and regulatory data come from the U.S. Army Corps of Engineers' National Inventory of Dams (NID). Weather forecast comes from NOAA / yr.no -- the same feed Snoflo's iOS app uses.
How often is the report updated?
NID structural data refreshes annually as the Corps publishes updated assessments. The weather forecast refreshes throughout the day.
What does the High hazard rating mean?
The Corps of Engineers' hazard potential classification grades probable consequences if the dam fails: High = probable loss of human life; Significant = no probable loss of human life but possible economic loss / environmental damage; Low = no probable loss of human life, only minor economic / environmental losses. See the Dam Data Reference card below for the full definitions.
What's "% of normal"?
The current storage value compared to the historical average storage on this calendar day. 100% = right on average; values above 100% mean above-normal storage (wet year); values below mean below-normal (dry year or drought).
Can I get alerts when storage crosses a threshold?
Yes -- alerts are managed in the Snoflo iOS app. Favorite this dam, set a threshold, and you'll get a push the moment conditions cross.
Dam data reference
Condition Assessment
- Satisfactory
- No existing or potential dam safety deficiencies are recognized. Acceptable performance is expected under all loading conditions (static, hydrologic, seismic) in accordance with the minimum applicable state or federal regulatory criteria or tolerable risk guidelines.
- Fair
- No existing dam safety deficiencies are recognized for normal operating conditions. Rare or extreme hydrologic and/or seismic events may result in a dam safety deficiency. Risk may be in the range to take further action.
- Poor
- A dam safety deficiency is recognized for normal operating conditions which may realistically occur. Remedial action is necessary. POOR may also be used when uncertainties exist as to critical analysis parameters which identify a potential dam safety deficiency.
- Unsatisfactory
- A dam safety deficiency is recognized that requires immediate or emergency remedial action for problem resolution.
- Not Rated
- The dam has not been inspected, is not under state or federal jurisdiction, or has been inspected but, for whatever reason, has not been rated.
Hazard Potential Classification
- High
- Dams assigned the high hazard potential classification are those where failure or mis-operation will probably cause loss of human life.
- Significant
- Dams assigned the significant hazard potential classification are those dams where failure or mis-operation results in no probable loss of human life but can cause economic loss, environmental damage, disruption of lifeline facilities, or impact other concerns. Significant hazard potential classification dams are often located in predominantly rural or agricultural areas but could be in areas with population and significant infrastructure.
- Low
- Dams assigned the low hazard potential classification are those where failure or mis-operation results in no probable loss of human life and low economic and/or environmental losses. Losses are principally limited to the owner's property.
- Undetermined
- Dams for which a downstream hazard potential has not been designated or is not provided.