Kent Pond Dam

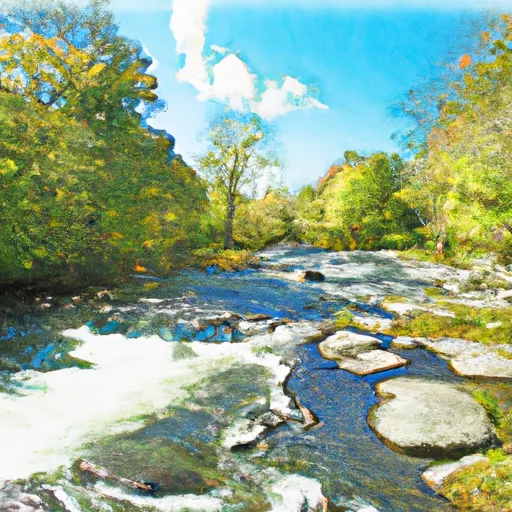
Kent Pond
Kent Pond in Killington, Vermont, is a state-regulated water resource with a primary purpose of recreation. Built in 1965 by designers Haley & Ward, this earth dam stands at a height of 27 feet and a length of 1450 feet, providing a storage capacity of 1160 acre-feet. The dam overlooks Kent Brook and serves as a popular spot for outdoor enthusiasts to enjoy water-based activities in a serene natural setting.
Despite its scenic beauty, Kent Pond's condition assessment is rated as poor, with a significant hazard potential. The last inspection in July 2015 revealed the need for improvements to ensure the safety and longevity of the structure. The dam's emergency action plan preparation status and risk assessment measures are also lacking, highlighting the importance of ongoing maintenance and monitoring to mitigate potential risks and ensure the protection of surrounding communities.
As climate change continues to impact water resources, the management and upkeep of dams like Kent Pond become crucial in adapting to changing environmental conditions. With its historical significance and recreational value, Kent Pond serves as a reminder of the delicate balance between human intervention and natural ecosystems, emphasizing the need for sustainable practices to safeguard our water sources for future generations.
Plan around the weather
Same NOAA / yr.no feed Snoflo's iOS app uses. Watch the precipitation column on the meteogram -- rain on the basin upstream typically lifts inflow 24-72 hours later.
Next 5 days, hour by hour
Temperature line with weather symbols on top, snow + rain accumulation as columns, humidity as a dotted line.
5-day forecast table
Every 3 hours, broken out across temperature, snow, rain, humidity, and wind. Each cell is colour-coded relative to the column min/max.
| Time | Condition | Temp (°F) | Snow (in) | Rain (in) | Humidity (%) | Wind (mps) | Wind dir |
|---|---|---|---|---|---|---|---|
| Loading detailed forecast… | |||||||
15-day temperature & precipitation
Daily temperatures, snow, and rain projected over the next two weeks.
Nearby streamflow gauges
USGS streamgauges around Kent Pond -- inflows here typically show up in storage 24-72 hours later.
| Streamgauge | Discharge | View |
|---|---|---|
| Ottauquechee River Near West Bridgewater | 12 cfs | → |
| Otter Creek At Center Rutland | 153 cfs | → |
| White River At West Hartford | 350 cfs | → |
| Ayers Brook At Randolph | 11 cfs | → |
| Ottauquechee River At North Hartland | 146 cfs | → |
| Connecticut River At West Lebanon | 2,330 cfs | → |


About Kent Pond
Where does the data for Kent Pond come from?
Structural and regulatory data come from the U.S. Army Corps of Engineers' National Inventory of Dams (NID). Weather forecast comes from NOAA / yr.no -- the same feed Snoflo's iOS app uses.
How often is the report updated?
NID structural data refreshes annually as the Corps publishes updated assessments. The weather forecast refreshes throughout the day.
What does the Significant hazard rating mean?
The Corps of Engineers' hazard potential classification grades probable consequences if the dam fails: High = probable loss of human life; Significant = no probable loss of human life but possible economic loss / environmental damage; Low = no probable loss of human life, only minor economic / environmental losses. See the Dam Data Reference card below for the full definitions.
What's "% of normal"?
The current storage value compared to the historical average storage on this calendar day. 100% = right on average; values above 100% mean above-normal storage (wet year); values below mean below-normal (dry year or drought).
Can I get alerts when storage crosses a threshold?
Yes -- alerts are managed in the Snoflo iOS app. Favorite this dam, set a threshold, and you'll get a push the moment conditions cross.
Dam data reference
Condition Assessment
- Satisfactory
- No existing or potential dam safety deficiencies are recognized. Acceptable performance is expected under all loading conditions (static, hydrologic, seismic) in accordance with the minimum applicable state or federal regulatory criteria or tolerable risk guidelines.
- Fair
- No existing dam safety deficiencies are recognized for normal operating conditions. Rare or extreme hydrologic and/or seismic events may result in a dam safety deficiency. Risk may be in the range to take further action.
- Poor
- A dam safety deficiency is recognized for normal operating conditions which may realistically occur. Remedial action is necessary. POOR may also be used when uncertainties exist as to critical analysis parameters which identify a potential dam safety deficiency.
- Unsatisfactory
- A dam safety deficiency is recognized that requires immediate or emergency remedial action for problem resolution.
- Not Rated
- The dam has not been inspected, is not under state or federal jurisdiction, or has been inspected but, for whatever reason, has not been rated.
Hazard Potential Classification
- High
- Dams assigned the high hazard potential classification are those where failure or mis-operation will probably cause loss of human life.
- Significant
- Dams assigned the significant hazard potential classification are those dams where failure or mis-operation results in no probable loss of human life but can cause economic loss, environmental damage, disruption of lifeline facilities, or impact other concerns. Significant hazard potential classification dams are often located in predominantly rural or agricultural areas but could be in areas with population and significant infrastructure.
- Low
- Dams assigned the low hazard potential classification are those where failure or mis-operation results in no probable loss of human life and low economic and/or environmental losses. Losses are principally limited to the owner's property.
- Undetermined
- Dams for which a downstream hazard potential has not been designated or is not provided.