Cave Mountain Dam

Cave Mountain
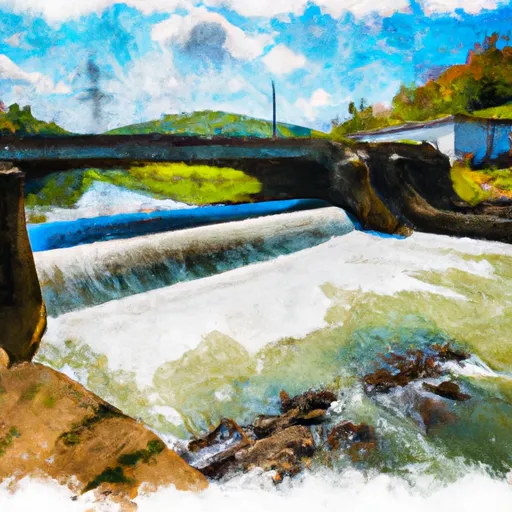
Cave Mountain in Rockbridge, Virginia, is a concrete dam with a primary purpose of recreation. Built in 1934 by the USDA Forest Service, this dam stands at a height of 30 feet and has a storage capacity of 37 acre-feet. Situated on the Back Run river, Cave Mountain Dam serves as a fish and wildlife pond, providing essential habitat for local species while also offering recreational opportunities for visitors to enjoy.
With a maximum discharge of 4000 cubic feet per second and a controlled spillway, the dam's hazard potential is rated as high, with a very high risk assessment. Despite its age, the dam's condition assessment is currently listed as "Not Rated," indicating a need for further inspection and evaluation. The emergency action plan status and risk management measures for Cave Mountain Dam are not specified, suggesting a potential area for improvement in ensuring the safety and security of the surrounding community in the event of a dam-related emergency.
Overall, Cave Mountain Dam serves as an important water resource and recreational site in Rockbridge, Virginia, managed by the Forest Service. As water resource and climate enthusiasts, it is essential to monitor and assess the condition and safety of structures like Cave Mountain Dam to ensure sustainable water management practices and effective risk mitigation strategies in the face of changing environmental conditions. By staying informed and proactive in addressing potential hazards and improving emergency preparedness, we can help protect both the natural ecosystem and the local community that rely on this vital water infrastructure.
Plan around the weather
Same NOAA / yr.no feed Snoflo's iOS app uses. Watch the precipitation column on the meteogram -- rain on the basin upstream typically lifts inflow 24-72 hours later.
Next 5 days, hour by hour
Temperature line with weather symbols on top, snow + rain accumulation as columns, humidity as a dotted line.
5-day forecast table
Every 3 hours, broken out across temperature, snow, rain, humidity, and wind. Each cell is colour-coded relative to the column min/max.
| Time | Condition | Temp (°F) | Snow (in) | Rain (in) | Humidity (%) | Wind (mps) | Wind dir |
|---|---|---|---|---|---|---|---|
| Loading detailed forecast… | |||||||
15-day temperature & precipitation
Daily temperatures, snow, and rain projected over the next two weeks.
Nearby streamflow gauges
USGS streamgauges around Cave Mountain -- inflows here typically show up in storage 24-72 hours later.
| Streamgauge | Discharge | View |
|---|---|---|
| James River At Buchanan | 650 cfs | → |
| Maury River Near Buena Vista | 76 cfs | → |
| James River At Holcomb Rock | 922 cfs | → |
| Big Otter River Near Bedford | 53 cfs | → |
| Pedlar River At Forest Road Near Buena Vista | 5 cfs | → |
| Kerrs Creek Near Lexington | 5 cfs | → |
Make a day of it
Boat launches, lakeside camping, fishing access, and other reservoirs near Cave Mountain.
Boat launches
See all →


Campgrounds
See all →


Fishing spots
See all →


River runs
See all →


More reservoirs
See all →

About Cave Mountain
Where does the data for Cave Mountain come from?
Structural and regulatory data come from the U.S. Army Corps of Engineers' National Inventory of Dams (NID). Weather forecast comes from NOAA / yr.no -- the same feed Snoflo's iOS app uses.
How often is the report updated?
NID structural data refreshes annually as the Corps publishes updated assessments. The weather forecast refreshes throughout the day.
What does the High hazard rating mean?
The Corps of Engineers' hazard potential classification grades probable consequences if the dam fails: High = probable loss of human life; Significant = no probable loss of human life but possible economic loss / environmental damage; Low = no probable loss of human life, only minor economic / environmental losses. See the Dam Data Reference card below for the full definitions.
What's "% of normal"?
The current storage value compared to the historical average storage on this calendar day. 100% = right on average; values above 100% mean above-normal storage (wet year); values below mean below-normal (dry year or drought).
Can I get alerts when storage crosses a threshold?
Yes -- alerts are managed in the Snoflo iOS app. Favorite this dam, set a threshold, and you'll get a push the moment conditions cross.
Dam data reference
Condition Assessment
- Satisfactory
- No existing or potential dam safety deficiencies are recognized. Acceptable performance is expected under all loading conditions (static, hydrologic, seismic) in accordance with the minimum applicable state or federal regulatory criteria or tolerable risk guidelines.
- Fair
- No existing dam safety deficiencies are recognized for normal operating conditions. Rare or extreme hydrologic and/or seismic events may result in a dam safety deficiency. Risk may be in the range to take further action.
- Poor
- A dam safety deficiency is recognized for normal operating conditions which may realistically occur. Remedial action is necessary. POOR may also be used when uncertainties exist as to critical analysis parameters which identify a potential dam safety deficiency.
- Unsatisfactory
- A dam safety deficiency is recognized that requires immediate or emergency remedial action for problem resolution.
- Not Rated
- The dam has not been inspected, is not under state or federal jurisdiction, or has been inspected but, for whatever reason, has not been rated.
Hazard Potential Classification
- High
- Dams assigned the high hazard potential classification are those where failure or mis-operation will probably cause loss of human life.
- Significant
- Dams assigned the significant hazard potential classification are those dams where failure or mis-operation results in no probable loss of human life but can cause economic loss, environmental damage, disruption of lifeline facilities, or impact other concerns. Significant hazard potential classification dams are often located in predominantly rural or agricultural areas but could be in areas with population and significant infrastructure.
- Low
- Dams assigned the low hazard potential classification are those where failure or mis-operation results in no probable loss of human life and low economic and/or environmental losses. Losses are principally limited to the owner's property.
- Undetermined
- Dams for which a downstream hazard potential has not been designated or is not provided.