Soda Lake Wetlands Dam

Soda Lake Wetlands
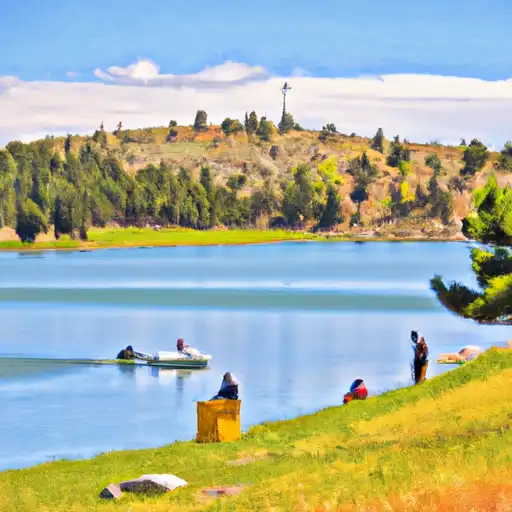
Soda Lake Wetlands, located in Sublette, Wyoming, is a state-owned fish and wildlife pond designed by Jon S. Ogden. The wetlands are regulated by the State of Wyoming and serve as a habitat for various species in the area. Completed in 1989, the earth dam stands at a height of 12 feet and has a hydraulic height of 6 feet, with a total structural height of 15 feet.
Covering a surface area of 24 acres with a drainage area of 3.9 square miles, the wetlands have a normal storage capacity of 105.26 acre-feet. The dam, primarily made of earth with stone core types and a soil foundation, features an uncontrolled spillway with a width of 20 feet. With a low hazard potential and fair condition assessment, the wetlands provide a valuable ecosystem for wildlife while also serving as a resource for water management and conservation efforts in the region.
Managed by the Sacramento District of the US Army Corps of Engineers, Soda Lake Wetlands is an essential component in the local water infrastructure, offering recreational and environmental benefits to the community. With its moderate risk assessment and regular state inspections, the wetlands continue to play a crucial role in maintaining water quality and supporting biodiversity in the area.
Plan around the weather
Same NOAA / yr.no feed Snoflo's iOS app uses. Watch the precipitation column on the meteogram -- rain on the basin upstream typically lifts inflow 24-72 hours later.
Next 5 days, hour by hour
Temperature line with weather symbols on top, snow + rain accumulation as columns, humidity as a dotted line.
5-day forecast table
Every 3 hours, broken out across temperature, snow, rain, humidity, and wind. Each cell is colour-coded relative to the column min/max.
| Time | Condition | Temp (°F) | Snow (in) | Rain (in) | Humidity (%) | Wind (mps) | Wind dir |
|---|---|---|---|---|---|---|---|
| Loading detailed forecast… | |||||||
15-day temperature & precipitation
Daily temperatures, snow, and rain projected over the next two weeks.
Nearby streamflow gauges
USGS streamgauges around Soda Lake Wetlands -- inflows here typically show up in storage 24-72 hours later.
| Streamgauge | Discharge | View |
|---|---|---|
| Pine Creek Above Fremont Lake | 385 cfs | → |
| Green River At Warren Bridge | 1,020 cfs | → |
| New Fork River Near Big Piney | 762 cfs | → |
| Dinwoody Creek Above Lakes | 567 cfs | → |
| Bull Lake Creek Above Bull Lake | 872 cfs | → |
| Wind River Above Red Creek | 953 cfs | → |


About Soda Lake Wetlands
Where does the data for Soda Lake Wetlands come from?
Structural and regulatory data come from the U.S. Army Corps of Engineers' National Inventory of Dams (NID). Weather forecast comes from NOAA / yr.no -- the same feed Snoflo's iOS app uses.
How often is the report updated?
NID structural data refreshes annually as the Corps publishes updated assessments. The weather forecast refreshes throughout the day.
What does the Low hazard rating mean?
The Corps of Engineers' hazard potential classification grades probable consequences if the dam fails: High = probable loss of human life; Significant = no probable loss of human life but possible economic loss / environmental damage; Low = no probable loss of human life, only minor economic / environmental losses. See the Dam Data Reference card below for the full definitions.
What's "% of normal"?
The current storage value compared to the historical average storage on this calendar day. 100% = right on average; values above 100% mean above-normal storage (wet year); values below mean below-normal (dry year or drought).
Can I get alerts when storage crosses a threshold?
Yes -- alerts are managed in the Snoflo iOS app. Favorite this dam, set a threshold, and you'll get a push the moment conditions cross.
Dam data reference
Condition Assessment
- Satisfactory
- No existing or potential dam safety deficiencies are recognized. Acceptable performance is expected under all loading conditions (static, hydrologic, seismic) in accordance with the minimum applicable state or federal regulatory criteria or tolerable risk guidelines.
- Fair
- No existing dam safety deficiencies are recognized for normal operating conditions. Rare or extreme hydrologic and/or seismic events may result in a dam safety deficiency. Risk may be in the range to take further action.
- Poor
- A dam safety deficiency is recognized for normal operating conditions which may realistically occur. Remedial action is necessary. POOR may also be used when uncertainties exist as to critical analysis parameters which identify a potential dam safety deficiency.
- Unsatisfactory
- A dam safety deficiency is recognized that requires immediate or emergency remedial action for problem resolution.
- Not Rated
- The dam has not been inspected, is not under state or federal jurisdiction, or has been inspected but, for whatever reason, has not been rated.
Hazard Potential Classification
- High
- Dams assigned the high hazard potential classification are those where failure or mis-operation will probably cause loss of human life.
- Significant
- Dams assigned the significant hazard potential classification are those dams where failure or mis-operation results in no probable loss of human life but can cause economic loss, environmental damage, disruption of lifeline facilities, or impact other concerns. Significant hazard potential classification dams are often located in predominantly rural or agricultural areas but could be in areas with population and significant infrastructure.
- Low
- Dams assigned the low hazard potential classification are those where failure or mis-operation results in no probable loss of human life and low economic and/or environmental losses. Losses are principally limited to the owner's property.
- Undetermined
- Dams for which a downstream hazard potential has not been designated or is not provided.