Poison Spring dam

Poison Spring
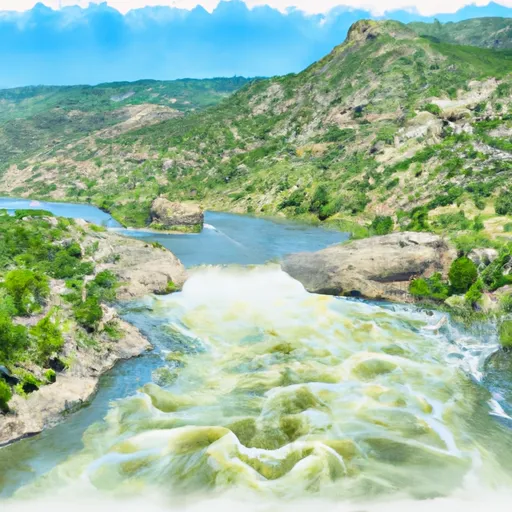
Poison Spring, located in Montrose, Colorado, is a privately-owned dam that serves multiple purposes including fire protection, stock, and small fish pond maintenance. Built in 1952, this earth dam stands at a height of 32 feet and spans a length of 520 feet, with a storage capacity of 202 acre-feet. The dam is situated along the Gunnison River and is regulated by the Colorado Department of Water Resources, ensuring that it meets state permitting, inspection, and enforcement standards.
Despite being categorized as low hazard potential and in fair condition, Poison Spring poses a high risk due to its location and the potential impact it could have in the event of a failure. With a maximum discharge capacity of 882 cubic feet per second and no spillway, the dam's emergency action plan readiness and risk management measures are areas of concern that need further assessment. The dam is also inspected every six years, with the last assessment in 2016, to ensure its structural integrity and compliance with safety guidelines.
Water resource and climate enthusiasts monitoring Poison Spring should be aware of its critical role in providing essential services to the surrounding community, while also recognizing the potential risks associated with its operation. As a key infrastructure for water supply and irrigation, maintaining the dam's safety and emergency preparedness measures are vital to safeguarding lives and property downstream. Continued monitoring and evaluation of Poison Spring's condition and risk assessment are essential to ensure the long-term sustainability and resilience of this important water resource infrastructure.
Plan around the weather
Same NOAA / yr.no feed Snoflo's iOS app uses. Watch the precipitation column on the meteogram -- rain on the basin upstream typically lifts inflow 24-72 hours later.
Next 5 days, hour by hour
Temperature line with weather symbols on top, snow + rain accumulation as columns, humidity as a dotted line.
5-day forecast table
Every 3 hours, broken out across temperature, snow, rain, humidity, and wind. Each cell is colour-coded relative to the column min/max.
| Time | Condition | Temp (°F) | Snow (in) | Rain (in) | Humidity (%) | Wind (mps) | Wind dir |
|---|---|---|---|---|---|---|---|
| Loading detailed forecast… | |||||||
15-day temperature & precipitation
Daily temperatures, snow, and rain projected over the next two weeks.
Nearby streamflow gauges
USGS streamgauges around Poison Spring -- inflows here typically show up in storage 24-72 hours later.
| Streamgauge | Discharge | View |
|---|---|---|
| Gunnison River Below Gunnison Tunnel | 435 cfs | → |
| Smith Fork Near Lazear | · | → |
| Cimarron River Bl Squaw Creek | 12 cfs | → |
| N.F. Gunnison R Blw Leroux Cr | 47 cfs | → |
| North Fk Gunnison River Above Mouth Nr Lazear | 31 cfs | → |
| North Fork Gunnison River Below Paonia | 18 cfs | → |
Make a day of it
Boat launches, lakeside camping, fishing access, and other reservoirs near Poison Spring.
Boat launches
See all →


Campgrounds
See all →


Fishing spots
See all →


River runs
See all →


About Poison Spring
Where does the data for Poison Spring come from?
Structural and regulatory data come from the U.S. Army Corps of Engineers' National Inventory of Dams (NID). Weather forecast comes from NOAA / yr.no -- the same feed Snoflo's iOS app uses.
How often is the report updated?
NID structural data refreshes annually as the Corps publishes updated assessments. The weather forecast refreshes throughout the day.
What does the Low hazard rating mean?
The Corps of Engineers' hazard potential classification grades probable consequences if the dam fails: High = probable loss of human life; Significant = no probable loss of human life but possible economic loss / environmental damage; Low = no probable loss of human life, only minor economic / environmental losses. See the Dam Data Reference card below for the full definitions.
What's "% of normal"?
The current storage value compared to the historical average storage on this calendar day. 100% = right on average; values above 100% mean above-normal storage (wet year); values below mean below-normal (dry year or drought).
Can I get alerts when storage crosses a threshold?
Yes -- alerts are managed in the Snoflo iOS app. Favorite this dam, set a threshold, and you'll get a push the moment conditions cross.
Dam data reference
Condition Assessment
- Satisfactory
- No existing or potential dam safety deficiencies are recognized. Acceptable performance is expected under all loading conditions (static, hydrologic, seismic) in accordance with the minimum applicable state or federal regulatory criteria or tolerable risk guidelines.
- Fair
- No existing dam safety deficiencies are recognized for normal operating conditions. Rare or extreme hydrologic and/or seismic events may result in a dam safety deficiency. Risk may be in the range to take further action.
- Poor
- A dam safety deficiency is recognized for normal operating conditions which may realistically occur. Remedial action is necessary. POOR may also be used when uncertainties exist as to critical analysis parameters which identify a potential dam safety deficiency.
- Unsatisfactory
- A dam safety deficiency is recognized that requires immediate or emergency remedial action for problem resolution.
- Not Rated
- The dam has not been inspected, is not under state or federal jurisdiction, or has been inspected but, for whatever reason, has not been rated.
Hazard Potential Classification
- High
- Dams assigned the high hazard potential classification are those where failure or mis-operation will probably cause loss of human life.
- Significant
- Dams assigned the significant hazard potential classification are those dams where failure or mis-operation results in no probable loss of human life but can cause economic loss, environmental damage, disruption of lifeline facilities, or impact other concerns. Significant hazard potential classification dams are often located in predominantly rural or agricultural areas but could be in areas with population and significant infrastructure.
- Low
- Dams assigned the low hazard potential classification are those where failure or mis-operation results in no probable loss of human life and low economic and/or environmental losses. Losses are principally limited to the owner's property.
- Undetermined
- Dams for which a downstream hazard potential has not been designated or is not provided.