Dove Pond Dam

Dove Pond Dam
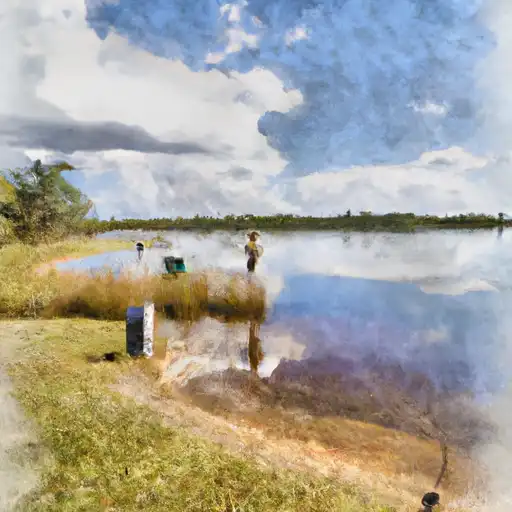
Dove Pond Dam, located in Tallahassee, Florida, is a privately owned structure managed by the Northwest Florida Water Management District. This dam serves primarily as a recreational feature, providing a surface area of 50 acres and a maximum storage capacity of 1140 acre-feet. With a height of 26 feet and a length of 1535 feet, Dove Pond Dam plays a crucial role in managing water resources in the region, especially within the closed basin it resides in.
Although the dam's condition assessment is currently listed as "Not Rated," its hazard potential is classified as "High," emphasizing the importance of regular inspections and maintenance. The last inspection was conducted in June 2020, highlighting the need for ongoing monitoring and risk management measures. Despite the lack of detailed information on the dam's emergency action plan and risk assessment, the structure's presence underscores the interconnectedness between water resources, climate factors, and infrastructure resilience in the face of potential hazards.
As water resource and climate enthusiasts, staying informed about the status and management of structures like Dove Pond Dam is essential for understanding the broader implications of climate change on water infrastructure. By recognizing the role of dams in water management and the potential risks they face, we can work towards promoting sustainable practices and resilience in the face of evolving environmental challenges. Let Dove Pond Dam serve as a reminder of the importance of proactive maintenance and risk mitigation strategies in safeguarding our water resources for future generations.
Plan around the weather
Same NOAA / yr.no feed Snoflo's iOS app uses. Watch the precipitation column on the meteogram -- rain on the basin upstream typically lifts inflow 24-72 hours later.
Next 5 days, hour by hour
Temperature line with weather symbols on top, snow + rain accumulation as columns, humidity as a dotted line.
5-day forecast table
Every 3 hours, broken out across temperature, snow, rain, humidity, and wind. Each cell is colour-coded relative to the column min/max.
| Time | Condition | Temp (°F) | Snow (in) | Rain (in) | Humidity (%) | Wind (mps) | Wind dir |
|---|---|---|---|---|---|---|---|
| Loading detailed forecast… | |||||||
15-day temperature & precipitation
Daily temperatures, snow, and rain projected over the next two weeks.
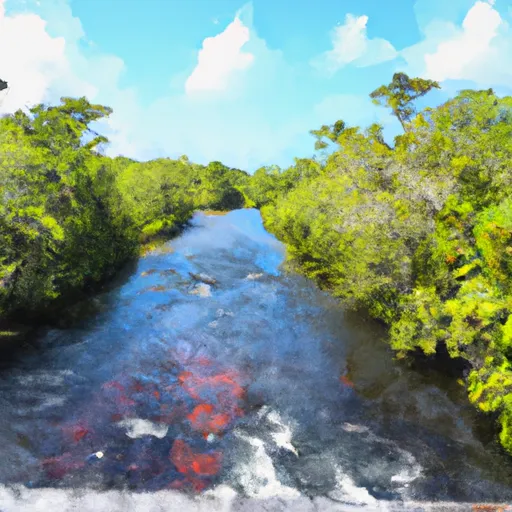
Nearby streamflow gauges
USGS streamgauges around Dove Pond Dam -- inflows here typically show up in storage 24-72 hours later.
| Streamgauge | Discharge | View |
|---|---|---|
| Ochlockonee River Nr Havana | 309 cfs | → |
| Ochlockonee River Nr Concord | 228 cfs | → |
| St. Marks River Near Newport | 469 cfs | → |
| Wacissa River Nr Wacissa Fla | 204 cfs | → |
| Little River Nr Quincy | 97 cfs | → |
| Wakulla River Near Crawfordville | 67 cfs | → |
Make a day of it
Boat launches, lakeside camping, fishing access, and other reservoirs near Dove Pond Dam.
Boat launches
See all →


Campgrounds
See all →


Fishing spots
See all →


River runs
See all →


More reservoirs
See all →
About Dove Pond Dam
Where does the data for Dove Pond Dam come from?
Structural and regulatory data come from the U.S. Army Corps of Engineers' National Inventory of Dams (NID). Weather forecast comes from NOAA / yr.no -- the same feed Snoflo's iOS app uses.
How often is the report updated?
NID structural data refreshes annually as the Corps publishes updated assessments. The weather forecast refreshes throughout the day.
What does the High hazard rating mean?
The Corps of Engineers' hazard potential classification grades probable consequences if the dam fails: High = probable loss of human life; Significant = no probable loss of human life but possible economic loss / environmental damage; Low = no probable loss of human life, only minor economic / environmental losses. See the Dam Data Reference card below for the full definitions.
What's "% of normal"?
The current storage value compared to the historical average storage on this calendar day. 100% = right on average; values above 100% mean above-normal storage (wet year); values below mean below-normal (dry year or drought).
Can I get alerts when storage crosses a threshold?
Yes -- alerts are managed in the Snoflo iOS app. Favorite this dam, set a threshold, and you'll get a push the moment conditions cross.
Dam data reference
Condition Assessment
- Satisfactory
- No existing or potential dam safety deficiencies are recognized. Acceptable performance is expected under all loading conditions (static, hydrologic, seismic) in accordance with the minimum applicable state or federal regulatory criteria or tolerable risk guidelines.
- Fair
- No existing dam safety deficiencies are recognized for normal operating conditions. Rare or extreme hydrologic and/or seismic events may result in a dam safety deficiency. Risk may be in the range to take further action.
- Poor
- A dam safety deficiency is recognized for normal operating conditions which may realistically occur. Remedial action is necessary. POOR may also be used when uncertainties exist as to critical analysis parameters which identify a potential dam safety deficiency.
- Unsatisfactory
- A dam safety deficiency is recognized that requires immediate or emergency remedial action for problem resolution.
- Not Rated
- The dam has not been inspected, is not under state or federal jurisdiction, or has been inspected but, for whatever reason, has not been rated.
Hazard Potential Classification
- High
- Dams assigned the high hazard potential classification are those where failure or mis-operation will probably cause loss of human life.
- Significant
- Dams assigned the significant hazard potential classification are those dams where failure or mis-operation results in no probable loss of human life but can cause economic loss, environmental damage, disruption of lifeline facilities, or impact other concerns. Significant hazard potential classification dams are often located in predominantly rural or agricultural areas but could be in areas with population and significant infrastructure.
- Low
- Dams assigned the low hazard potential classification are those where failure or mis-operation results in no probable loss of human life and low economic and/or environmental losses. Losses are principally limited to the owner's property.
- Undetermined
- Dams for which a downstream hazard potential has not been designated or is not provided.