Berrong Mill Pond Dam Dam

Berrong Mill Pond Dam
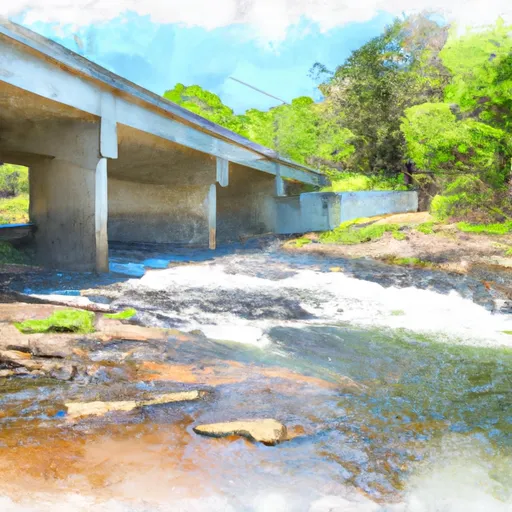
Located in the charming county of Towns, Georgia, the Berrong Mill Pond Dam stands as a testament to the importance of water resource management for recreational purposes. This private-owned earth dam, constructed with a buttress core type, boasts a height of 24 feet and a length of 220 feet. The dam creates a picturesque pond with a storage capacity of 99 acre-feet and a surface area of 8 acres, providing a serene escape for visitors seeking outdoor activities such as fishing or boating.
Situated on the scenic Little Hightower Creek, the Berrong Mill Pond Dam has been deemed to have a low hazard potential and a moderate risk assessment level. Despite not being state-regulated or inspected, the dam's condition is currently not rated, highlighting the need for regular monitoring and maintenance to ensure its structural integrity and safety. With its uncontrolled spillway and outlet gates, the dam serves as a vital resource for the local community, attracting water resource and climate enthusiasts who appreciate the beauty and functionality of this recreational structure.
As water enthusiasts and climate advocates continue to explore the Berrong Mill Pond Dam, its significance in providing a natural habitat for wildlife and a peaceful retreat for outdoor enthusiasts becomes increasingly clear. While the dam's risk assessment level and hazard potential are moderate, efforts to implement proper risk management measures and emergency action plans are crucial to safeguarding this cherished water resource. With its idyllic location and recreational appeal, the Berrong Mill Pond Dam serves as a reminder of the delicate balance between human enjoyment and environmental conservation in the realm of water resource management.
Plan around the weather
Same NOAA / yr.no feed Snoflo's iOS app uses. Watch the precipitation column on the meteogram -- rain on the basin upstream typically lifts inflow 24-72 hours later.
Next 5 days, hour by hour
Temperature line with weather symbols on top, snow + rain accumulation as columns, humidity as a dotted line.
5-day forecast table
Every 3 hours, broken out across temperature, snow, rain, humidity, and wind. Each cell is colour-coded relative to the column min/max.
| Time | Condition | Temp (°F) | Snow (in) | Rain (in) | Humidity (%) | Wind (mps) | Wind dir |
|---|---|---|---|---|---|---|---|
| Loading detailed forecast… | |||||||
15-day temperature & precipitation
Daily temperatures, snow, and rain projected over the next two weeks.
Nearby streamflow gauges
USGS streamgauges around Berrong Mill Pond Dam -- inflows here typically show up in storage 24-72 hours later.
| Streamgauge | Discharge | View |
|---|---|---|
| Tallulah River Near Clayton | 107 cfs | → |
| Nantahala River Near Rainbow Springs | 171 cfs | → |
| Chattahoochee River At Helen | 46 cfs | → |
| Nottely River Near Blairsville | 61 cfs | → |
| Tallulah River Ab Powerhouse | 37 cfs | → |
| Chattooga River Near Clayton | 243 cfs | → |
Make a day of it
Boat launches, lakeside camping, fishing access, and other reservoirs near Berrong Mill Pond Dam.
Boat launches
See all →


Campgrounds
See all →


Fishing spots
See all →


River runs
See all →


More reservoirs
See all →
About Berrong Mill Pond Dam
Where does the data for Berrong Mill Pond Dam come from?
Structural and regulatory data come from the U.S. Army Corps of Engineers' National Inventory of Dams (NID). Weather forecast comes from NOAA / yr.no -- the same feed Snoflo's iOS app uses.
How often is the report updated?
NID structural data refreshes annually as the Corps publishes updated assessments. The weather forecast refreshes throughout the day.
What does the Low hazard rating mean?
The Corps of Engineers' hazard potential classification grades probable consequences if the dam fails: High = probable loss of human life; Significant = no probable loss of human life but possible economic loss / environmental damage; Low = no probable loss of human life, only minor economic / environmental losses. See the Dam Data Reference card below for the full definitions.
What's "% of normal"?
The current storage value compared to the historical average storage on this calendar day. 100% = right on average; values above 100% mean above-normal storage (wet year); values below mean below-normal (dry year or drought).
Can I get alerts when storage crosses a threshold?
Yes -- alerts are managed in the Snoflo iOS app. Favorite this dam, set a threshold, and you'll get a push the moment conditions cross.
Dam data reference
Condition Assessment
- Satisfactory
- No existing or potential dam safety deficiencies are recognized. Acceptable performance is expected under all loading conditions (static, hydrologic, seismic) in accordance with the minimum applicable state or federal regulatory criteria or tolerable risk guidelines.
- Fair
- No existing dam safety deficiencies are recognized for normal operating conditions. Rare or extreme hydrologic and/or seismic events may result in a dam safety deficiency. Risk may be in the range to take further action.
- Poor
- A dam safety deficiency is recognized for normal operating conditions which may realistically occur. Remedial action is necessary. POOR may also be used when uncertainties exist as to critical analysis parameters which identify a potential dam safety deficiency.
- Unsatisfactory
- A dam safety deficiency is recognized that requires immediate or emergency remedial action for problem resolution.
- Not Rated
- The dam has not been inspected, is not under state or federal jurisdiction, or has been inspected but, for whatever reason, has not been rated.
Hazard Potential Classification
- High
- Dams assigned the high hazard potential classification are those where failure or mis-operation will probably cause loss of human life.
- Significant
- Dams assigned the significant hazard potential classification are those dams where failure or mis-operation results in no probable loss of human life but can cause economic loss, environmental damage, disruption of lifeline facilities, or impact other concerns. Significant hazard potential classification dams are often located in predominantly rural or agricultural areas but could be in areas with population and significant infrastructure.
- Low
- Dams assigned the low hazard potential classification are those where failure or mis-operation results in no probable loss of human life and low economic and/or environmental losses. Losses are principally limited to the owner's property.
- Undetermined
- Dams for which a downstream hazard potential has not been designated or is not provided.