Lake Kathy Dam Dam

Lake Kathy Dam
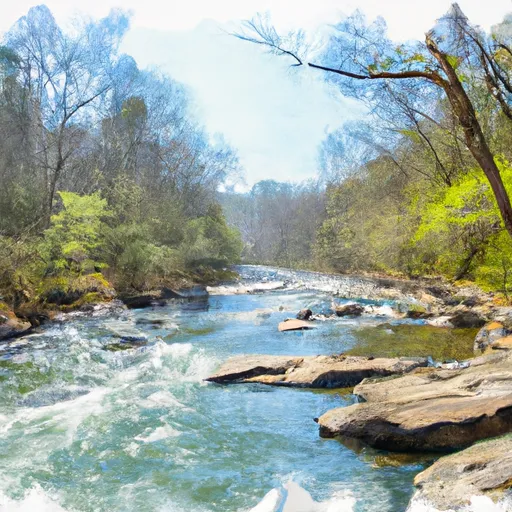
Lake Kathy Dam, located in Whitfield, Georgia, stands as a vital structure for recreation enthusiasts and climate activists alike. Built in 1950, this privately-owned Earth dam stands at a height of 17 feet and boasts a storage capacity of 291 acre-feet. With a primary purpose of recreation, the dam offers a serene escape for visitors seeking to enjoy the 25-acre surface area of Lake Kathy.
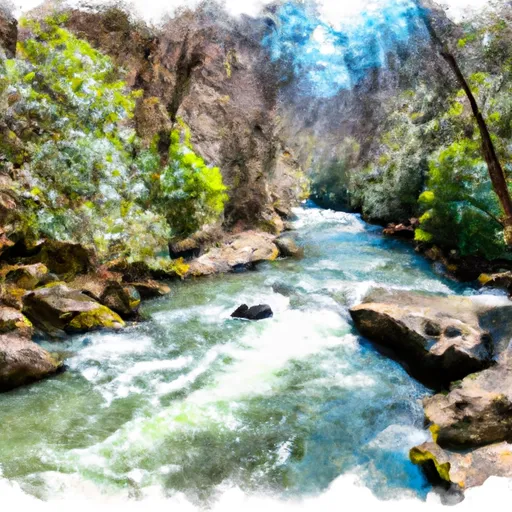
Despite its scenic appeal, Lake Kathy Dam poses a high hazard potential due to its poor condition assessment as of March 2017. The dam's uncontrolled spillway and outlet gates raise concerns for safety and necessitate regular inspections. The Georgia-Safe Dams Program regulates this structure, ensuring compliance with state permitting, inspection, and enforcement protocols to mitigate risks and protect surrounding communities.
As water resource and climate enthusiasts monitor the condition of Lake Kathy Dam, the need for proactive risk management measures becomes evident. With a moderate risk assessment rating, there is a call to action to enhance emergency preparedness and safety protocols. By collaborating with state regulators and stakeholders, efforts can be made to improve the dam's condition and ensure its long-term sustainability, safeguarding both the environment and the local community.
Plan around the weather
Same NOAA / yr.no feed Snoflo's iOS app uses. Watch the precipitation column on the meteogram -- rain on the basin upstream typically lifts inflow 24-72 hours later.
Next 5 days, hour by hour
Temperature line with weather symbols on top, snow + rain accumulation as columns, humidity as a dotted line.
5-day forecast table
Every 3 hours, broken out across temperature, snow, rain, humidity, and wind. Each cell is colour-coded relative to the column min/max.
| Time | Condition | Temp (°F) | Snow (in) | Rain (in) | Humidity (%) | Wind (mps) | Wind dir |
|---|---|---|---|---|---|---|---|
| Loading detailed forecast… | |||||||
15-day temperature & precipitation
Daily temperatures, snow, and rain projected over the next two weeks.
Nearby streamflow gauges
USGS streamgauges around Lake Kathy Dam -- inflows here typically show up in storage 24-72 hours later.
| Streamgauge | Discharge | View |
|---|---|---|
| Mill Creek At Dalton | 15 cfs | → |
| Conasauga River Near Eton | 302 cfs | → |
| South Chickamauga Creek Near Chickamauga | 362 cfs | → |
| Mill Creek Near Crandall | 8 cfs | → |
| Conasauga River At Tilton | 369 cfs | → |
| Holly Creek Near Chatsworth | 67 cfs | → |
Make a day of it
Boat launches, lakeside camping, fishing access, and other reservoirs near Lake Kathy Dam.
Boat launches
See all →


Campgrounds
See all →


Fishing spots
See all →


River runs
See all →


About Lake Kathy Dam
Where does the data for Lake Kathy Dam come from?
Structural and regulatory data come from the U.S. Army Corps of Engineers' National Inventory of Dams (NID). Weather forecast comes from NOAA / yr.no -- the same feed Snoflo's iOS app uses.
How often is the report updated?
NID structural data refreshes annually as the Corps publishes updated assessments. The weather forecast refreshes throughout the day.
What does the High hazard rating mean?
The Corps of Engineers' hazard potential classification grades probable consequences if the dam fails: High = probable loss of human life; Significant = no probable loss of human life but possible economic loss / environmental damage; Low = no probable loss of human life, only minor economic / environmental losses. See the Dam Data Reference card below for the full definitions.
What's "% of normal"?
The current storage value compared to the historical average storage on this calendar day. 100% = right on average; values above 100% mean above-normal storage (wet year); values below mean below-normal (dry year or drought).
Can I get alerts when storage crosses a threshold?
Yes -- alerts are managed in the Snoflo iOS app. Favorite this dam, set a threshold, and you'll get a push the moment conditions cross.
Dam data reference
Condition Assessment
- Satisfactory
- No existing or potential dam safety deficiencies are recognized. Acceptable performance is expected under all loading conditions (static, hydrologic, seismic) in accordance with the minimum applicable state or federal regulatory criteria or tolerable risk guidelines.
- Fair
- No existing dam safety deficiencies are recognized for normal operating conditions. Rare or extreme hydrologic and/or seismic events may result in a dam safety deficiency. Risk may be in the range to take further action.
- Poor
- A dam safety deficiency is recognized for normal operating conditions which may realistically occur. Remedial action is necessary. POOR may also be used when uncertainties exist as to critical analysis parameters which identify a potential dam safety deficiency.
- Unsatisfactory
- A dam safety deficiency is recognized that requires immediate or emergency remedial action for problem resolution.
- Not Rated
- The dam has not been inspected, is not under state or federal jurisdiction, or has been inspected but, for whatever reason, has not been rated.
Hazard Potential Classification
- High
- Dams assigned the high hazard potential classification are those where failure or mis-operation will probably cause loss of human life.
- Significant
- Dams assigned the significant hazard potential classification are those dams where failure or mis-operation results in no probable loss of human life but can cause economic loss, environmental damage, disruption of lifeline facilities, or impact other concerns. Significant hazard potential classification dams are often located in predominantly rural or agricultural areas but could be in areas with population and significant infrastructure.
- Low
- Dams assigned the low hazard potential classification are those where failure or mis-operation results in no probable loss of human life and low economic and/or environmental losses. Losses are principally limited to the owner's property.
- Undetermined
- Dams for which a downstream hazard potential has not been designated or is not provided.