Lower Vallecito Dam dam

Lower Vallecito Dam
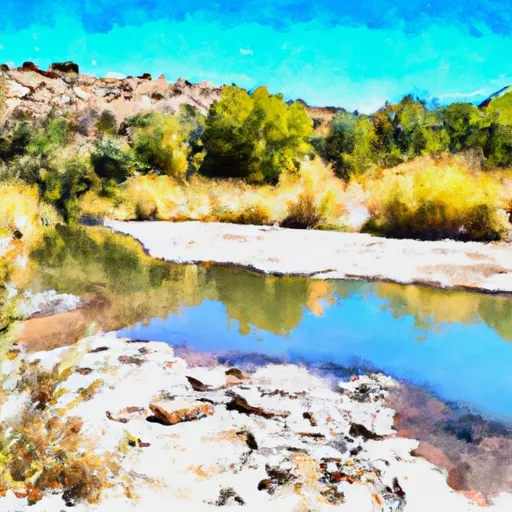
Lower Vallecito Dam, also known as Upper Ponderosa Dam, is a vital structure located in Sandoval, New Mexico, owned by the local government. Completed in 1947, the earth dam stands at a height of 32.7 feet and serves primarily for irrigation purposes, with a storage capacity of 80 acre-feet. The dam regulates Vallecito Creek and covers a surface area of 4.5 acres, with a drainage area of 16.4 square miles.
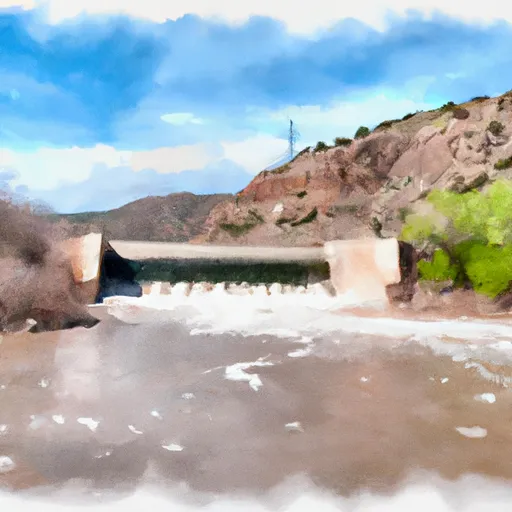
Despite its essential role in water resource management, Lower Vallecito Dam is classified as having a high hazard potential and poor condition assessment. Inspected in June 2020, the dam is subject to regulatory oversight by the Office of the State Engineer in New Mexico. With a spillway width of 19 feet and a maximum discharge of 362 cubic feet per second, the dam poses moderate risk (rated 3) for potential emergencies. Upkeep and maintenance are crucial to ensure the safety and functionality of this critical infrastructure for the surrounding community.
The dam's location in Ponderosa, New Mexico, and its association with Vallecito Creek highlight its significance in the local ecosystem and agricultural activities. Water resource and climate enthusiasts can appreciate the engineering complexities involved in managing irrigation and flood control through this earth dam. As efforts continue to address the dam's poor condition and high hazard potential, collaboration among stakeholders is essential to safeguard the surrounding areas and ensure sustainable water management for future generations.
Plan around the weather
Same NOAA / yr.no feed Snoflo's iOS app uses. Watch the precipitation column on the meteogram -- rain on the basin upstream typically lifts inflow 24-72 hours later.
Next 5 days, hour by hour
Temperature line with weather symbols on top, snow + rain accumulation as columns, humidity as a dotted line.
5-day forecast table
Every 3 hours, broken out across temperature, snow, rain, humidity, and wind. Each cell is colour-coded relative to the column min/max.
| Time | Condition | Temp (°F) | Snow (in) | Rain (in) | Humidity (%) | Wind (mps) | Wind dir |
|---|---|---|---|---|---|---|---|
| Loading detailed forecast… | |||||||
15-day temperature & precipitation
Daily temperatures, snow, and rain projected over the next two weeks.
Nearby streamflow gauges
USGS streamgauges around Lower Vallecito Dam -- inflows here typically show up in storage 24-72 hours later.
| Streamgauge | Discharge | View |
|---|---|---|
| Jemez River Near Jemez | 6 cfs | → |
| Rio Grande Below Cochiti Dam | 126 cfs | → |
| Rio Grande At San Felipe | 532 cfs | → |
| Rito De Los Frijoles In Bandelier Nat Mon | 1 cfs | → |
| Santa Fe River Above Cochiti Lake | 0 cfs | → |
| Galisteo Creek Below Galisteo Dam | · | → |


About Lower Vallecito Dam
Where does the data for Lower Vallecito Dam come from?
Structural and regulatory data come from the U.S. Army Corps of Engineers' National Inventory of Dams (NID). Weather forecast comes from NOAA / yr.no -- the same feed Snoflo's iOS app uses.
How often is the report updated?
NID structural data refreshes annually as the Corps publishes updated assessments. The weather forecast refreshes throughout the day.
What does the High hazard rating mean?
The Corps of Engineers' hazard potential classification grades probable consequences if the dam fails: High = probable loss of human life; Significant = no probable loss of human life but possible economic loss / environmental damage; Low = no probable loss of human life, only minor economic / environmental losses. See the Dam Data Reference card below for the full definitions.
What's "% of normal"?
The current storage value compared to the historical average storage on this calendar day. 100% = right on average; values above 100% mean above-normal storage (wet year); values below mean below-normal (dry year or drought).
Can I get alerts when storage crosses a threshold?
Yes -- alerts are managed in the Snoflo iOS app. Favorite this dam, set a threshold, and you'll get a push the moment conditions cross.
Dam data reference
Condition Assessment
- Satisfactory
- No existing or potential dam safety deficiencies are recognized. Acceptable performance is expected under all loading conditions (static, hydrologic, seismic) in accordance with the minimum applicable state or federal regulatory criteria or tolerable risk guidelines.
- Fair
- No existing dam safety deficiencies are recognized for normal operating conditions. Rare or extreme hydrologic and/or seismic events may result in a dam safety deficiency. Risk may be in the range to take further action.
- Poor
- A dam safety deficiency is recognized for normal operating conditions which may realistically occur. Remedial action is necessary. POOR may also be used when uncertainties exist as to critical analysis parameters which identify a potential dam safety deficiency.
- Unsatisfactory
- A dam safety deficiency is recognized that requires immediate or emergency remedial action for problem resolution.
- Not Rated
- The dam has not been inspected, is not under state or federal jurisdiction, or has been inspected but, for whatever reason, has not been rated.
Hazard Potential Classification
- High
- Dams assigned the high hazard potential classification are those where failure or mis-operation will probably cause loss of human life.
- Significant
- Dams assigned the significant hazard potential classification are those dams where failure or mis-operation results in no probable loss of human life but can cause economic loss, environmental damage, disruption of lifeline facilities, or impact other concerns. Significant hazard potential classification dams are often located in predominantly rural or agricultural areas but could be in areas with population and significant infrastructure.
- Low
- Dams assigned the low hazard potential classification are those where failure or mis-operation results in no probable loss of human life and low economic and/or environmental losses. Losses are principally limited to the owner's property.
- Undetermined
- Dams for which a downstream hazard potential has not been designated or is not provided.