Wilburn Dam

Wilburn Dam
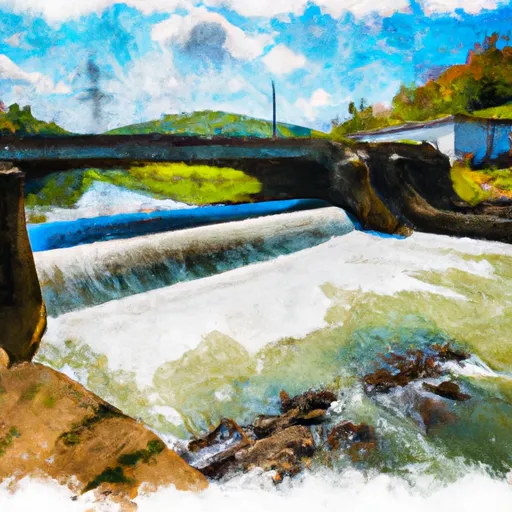
Wilburn Dam, located in Botetourt, Virginia, is a privately owned structure primarily used for recreation. This Earth-type dam stands at 26 feet high and stretches 143 feet long, with a storage capacity of 63.54 acre-feet. The dam is regulated by the Department of Conservation and Recreation, ensuring that it meets state inspection and enforcement standards. Despite its undetermined hazard potential and lack of a current condition rating, the dam continues to serve as a popular spot for outdoor enthusiasts in the area.
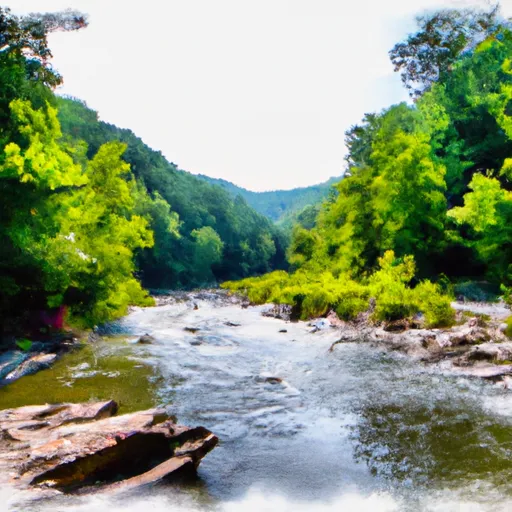
With a scenic surface area of 5.67 acres and a drainage area of 0.94 acres, Wilburn Dam provides a tranquil setting for visitors to enjoy nature and engage in recreational activities. While the dam's spillway type and maximum discharge capacity are not specified, its role in providing water-based leisure opportunities is unmistakable. The dam's location in the Wilmington District further underscores its significance as a water resource and climate management asset in the region, attracting visitors seeking solace in its serene waters.
As water resource and climate enthusiasts explore the beauty of Wilburn Dam, they can appreciate its contribution to the local ecosystem and community. With a focus on recreation, this privately owned structure exemplifies the balance between human enjoyment and environmental stewardship. Despite uncertainties regarding its hazard potential and condition assessment, Wilburn Dam remains a cherished landmark in Botetourt, Virginia, embodying the interconnectedness of water management, leisure activities, and natural preservation.
Plan around the weather
Same NOAA / yr.no feed Snoflo's iOS app uses. Watch the precipitation column on the meteogram -- rain on the basin upstream typically lifts inflow 24-72 hours later.
Next 5 days, hour by hour
Temperature line with weather symbols on top, snow + rain accumulation as columns, humidity as a dotted line.
5-day forecast table
Every 3 hours, broken out across temperature, snow, rain, humidity, and wind. Each cell is colour-coded relative to the column min/max.
| Time | Condition | Temp (°F) | Snow (in) | Rain (in) | Humidity (%) | Wind (mps) | Wind dir |
|---|---|---|---|---|---|---|---|
| Loading detailed forecast… | |||||||
15-day temperature & precipitation
Daily temperatures, snow, and rain projected over the next two weeks.
Nearby streamflow gauges
USGS streamgauges around Wilburn Dam -- inflows here typically show up in storage 24-72 hours later.
| Streamgauge | Discharge | View |
|---|---|---|
| James River At Buchanan | 650 cfs | → |
| Tinker Creek Near Daleville | 1 cfs | → |
| Catawba Creek Near Catawba | 4 cfs | → |
| Roanoke River At Niagara | 169 cfs | → |
| Roanoke River At Roanoke | 98 cfs | → |
| Back Creek Near Dundee | 19 cfs | → |
Make a day of it
Boat launches, lakeside camping, fishing access, and other reservoirs near Wilburn Dam.
Boat launches
See all →


Campgrounds
See all →


Fishing spots
See all →
River runs
See all →


About Wilburn Dam
Where does the data for Wilburn Dam come from?
Structural and regulatory data come from the U.S. Army Corps of Engineers' National Inventory of Dams (NID). Weather forecast comes from NOAA / yr.no -- the same feed Snoflo's iOS app uses.
How often is the report updated?
NID structural data refreshes annually as the Corps publishes updated assessments. The weather forecast refreshes throughout the day.
What does the Undetermined hazard rating mean?
The Corps of Engineers' hazard potential classification grades probable consequences if the dam fails: High = probable loss of human life; Significant = no probable loss of human life but possible economic loss / environmental damage; Low = no probable loss of human life, only minor economic / environmental losses. See the Dam Data Reference card below for the full definitions.
What's "% of normal"?
The current storage value compared to the historical average storage on this calendar day. 100% = right on average; values above 100% mean above-normal storage (wet year); values below mean below-normal (dry year or drought).
Can I get alerts when storage crosses a threshold?
Yes -- alerts are managed in the Snoflo iOS app. Favorite this dam, set a threshold, and you'll get a push the moment conditions cross.
Dam data reference
Condition Assessment
- Satisfactory
- No existing or potential dam safety deficiencies are recognized. Acceptable performance is expected under all loading conditions (static, hydrologic, seismic) in accordance with the minimum applicable state or federal regulatory criteria or tolerable risk guidelines.
- Fair
- No existing dam safety deficiencies are recognized for normal operating conditions. Rare or extreme hydrologic and/or seismic events may result in a dam safety deficiency. Risk may be in the range to take further action.
- Poor
- A dam safety deficiency is recognized for normal operating conditions which may realistically occur. Remedial action is necessary. POOR may also be used when uncertainties exist as to critical analysis parameters which identify a potential dam safety deficiency.
- Unsatisfactory
- A dam safety deficiency is recognized that requires immediate or emergency remedial action for problem resolution.
- Not Rated
- The dam has not been inspected, is not under state or federal jurisdiction, or has been inspected but, for whatever reason, has not been rated.
Hazard Potential Classification
- High
- Dams assigned the high hazard potential classification are those where failure or mis-operation will probably cause loss of human life.
- Significant
- Dams assigned the significant hazard potential classification are those dams where failure or mis-operation results in no probable loss of human life but can cause economic loss, environmental damage, disruption of lifeline facilities, or impact other concerns. Significant hazard potential classification dams are often located in predominantly rural or agricultural areas but could be in areas with population and significant infrastructure.
- Low
- Dams assigned the low hazard potential classification are those where failure or mis-operation results in no probable loss of human life and low economic and/or environmental losses. Losses are principally limited to the owner's property.
- Undetermined
- Dams for which a downstream hazard potential has not been designated or is not provided.