Falls Mill Dam

Falls Mill Dam
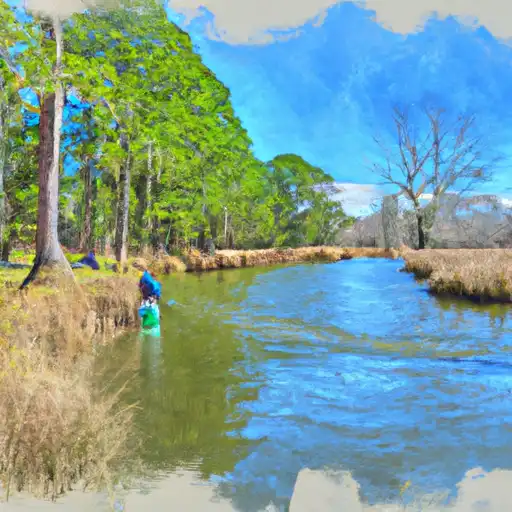
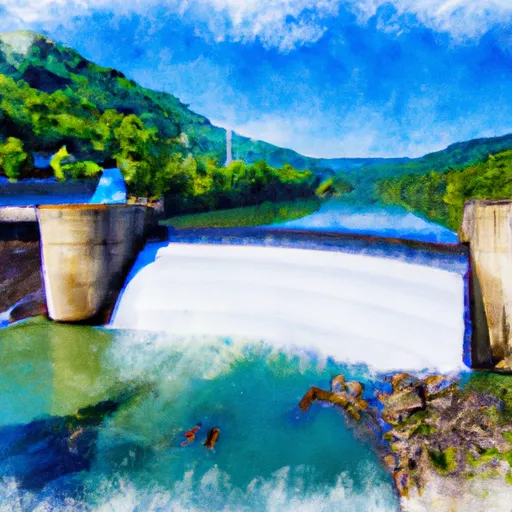
Falls Mill Dam, located in Tazewell, Virginia, along the Mud Fork river, is a rockfill dam with a height of 22 feet and a length of 445 feet. The dam serves primarily for recreational purposes, providing a serene and picturesque setting for water resource and climate enthusiasts to enjoy. With a storage capacity of 990 acre-feet and a surface area of 95.6 acres, Falls Mill Dam offers ample opportunities for outdoor activities such as fishing, boating, and wildlife observation.
Despite its fair condition assessment and high hazard potential, Falls Mill Dam is regulated, inspected, and enforced by the Virginia Department of Conservation and Recreation to ensure public safety and environmental protection. The dam underwent its last inspection in November 2020, with an inspection frequency of once a year. While the dam does not have a spillway or outlet gates, its design and construction meet the necessary standards to mitigate risks and maintain structural integrity. With its critical role in the local water resource management, Falls Mill Dam remains a vital asset for the community and a popular destination for nature lovers seeking a tranquil retreat in the heart of Virginia's countryside.
Plan around the weather
Same NOAA / yr.no feed Snoflo's iOS app uses. Watch the precipitation column on the meteogram -- rain on the basin upstream typically lifts inflow 24-72 hours later.
Next 5 days, hour by hour
Temperature line with weather symbols on top, snow + rain accumulation as columns, humidity as a dotted line.
5-day forecast table
Every 3 hours, broken out across temperature, snow, rain, humidity, and wind. Each cell is colour-coded relative to the column min/max.
| Time | Condition | Temp (°F) | Snow (in) | Rain (in) | Humidity (%) | Wind (mps) | Wind dir |
|---|---|---|---|---|---|---|---|
| Loading detailed forecast… | |||||||
15-day temperature & precipitation
Daily temperatures, snow, and rain projected over the next two weeks.
Nearby streamflow gauges
USGS streamgauges around Falls Mill Dam -- inflows here typically show up in storage 24-72 hours later.
| Streamgauge | Discharge | View |
|---|---|---|
| Bluestone River At Falls Mills | 39 cfs | → |
| Tug Fork At Welch | 102 cfs | → |
| Bluestone River Near Pipestem | 221 cfs | → |
| Wolf Creek Near Narrows | 117 cfs | → |
| New River At Glen Lyn | 2,850 cfs | → |
| Dry Fork At Beartown | 102 cfs | → |
Make a day of it
Boat launches, lakeside camping, fishing access, and other reservoirs near Falls Mill Dam.
Boat launches
See all →


Campgrounds
See all →


Fishing spots
See all →
River runs
See all →


About Falls Mill Dam
Where does the data for Falls Mill Dam come from?
Structural and regulatory data come from the U.S. Army Corps of Engineers' National Inventory of Dams (NID). Weather forecast comes from NOAA / yr.no -- the same feed Snoflo's iOS app uses.
How often is the report updated?
NID structural data refreshes annually as the Corps publishes updated assessments. The weather forecast refreshes throughout the day.
What does the High hazard rating mean?
The Corps of Engineers' hazard potential classification grades probable consequences if the dam fails: High = probable loss of human life; Significant = no probable loss of human life but possible economic loss / environmental damage; Low = no probable loss of human life, only minor economic / environmental losses. See the Dam Data Reference card below for the full definitions.
What's "% of normal"?
The current storage value compared to the historical average storage on this calendar day. 100% = right on average; values above 100% mean above-normal storage (wet year); values below mean below-normal (dry year or drought).
Can I get alerts when storage crosses a threshold?
Yes -- alerts are managed in the Snoflo iOS app. Favorite this dam, set a threshold, and you'll get a push the moment conditions cross.
Dam data reference
Condition Assessment
- Satisfactory
- No existing or potential dam safety deficiencies are recognized. Acceptable performance is expected under all loading conditions (static, hydrologic, seismic) in accordance with the minimum applicable state or federal regulatory criteria or tolerable risk guidelines.
- Fair
- No existing dam safety deficiencies are recognized for normal operating conditions. Rare or extreme hydrologic and/or seismic events may result in a dam safety deficiency. Risk may be in the range to take further action.
- Poor
- A dam safety deficiency is recognized for normal operating conditions which may realistically occur. Remedial action is necessary. POOR may also be used when uncertainties exist as to critical analysis parameters which identify a potential dam safety deficiency.
- Unsatisfactory
- A dam safety deficiency is recognized that requires immediate or emergency remedial action for problem resolution.
- Not Rated
- The dam has not been inspected, is not under state or federal jurisdiction, or has been inspected but, for whatever reason, has not been rated.
Hazard Potential Classification
- High
- Dams assigned the high hazard potential classification are those where failure or mis-operation will probably cause loss of human life.
- Significant
- Dams assigned the significant hazard potential classification are those dams where failure or mis-operation results in no probable loss of human life but can cause economic loss, environmental damage, disruption of lifeline facilities, or impact other concerns. Significant hazard potential classification dams are often located in predominantly rural or agricultural areas but could be in areas with population and significant infrastructure.
- Low
- Dams assigned the low hazard potential classification are those where failure or mis-operation results in no probable loss of human life and low economic and/or environmental losses. Losses are principally limited to the owner's property.
- Undetermined
- Dams for which a downstream hazard potential has not been designated or is not provided.